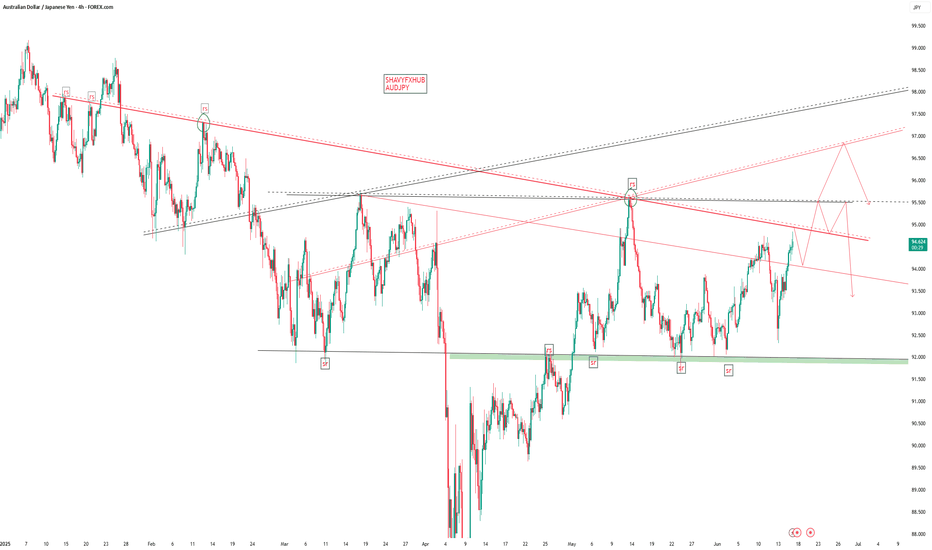
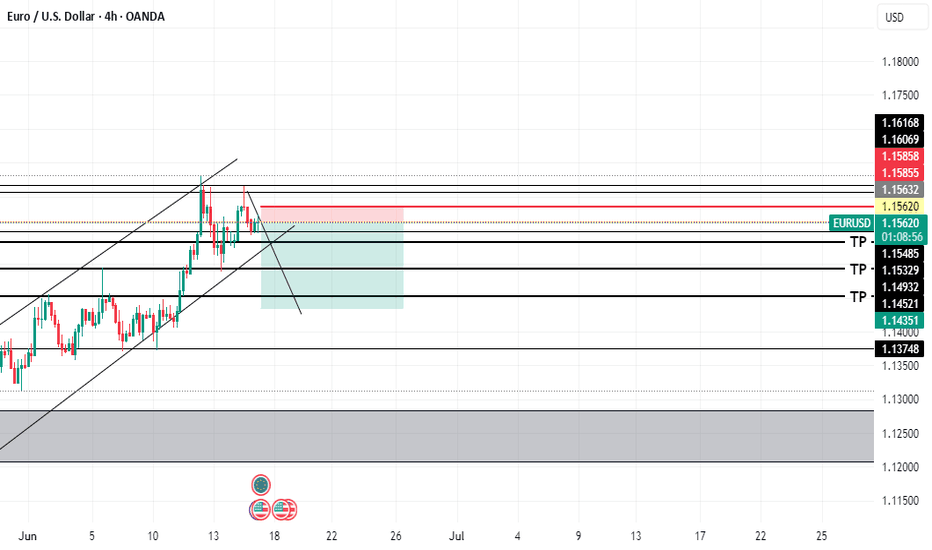
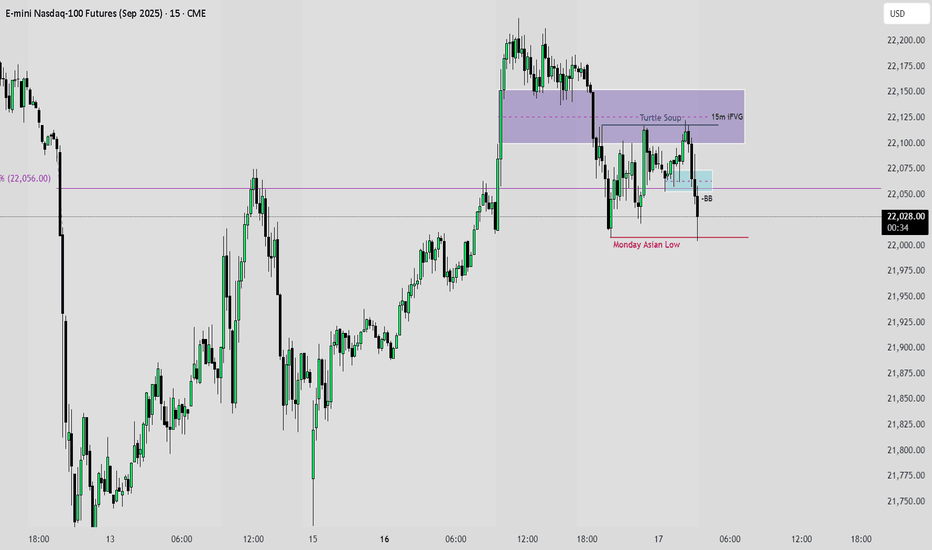
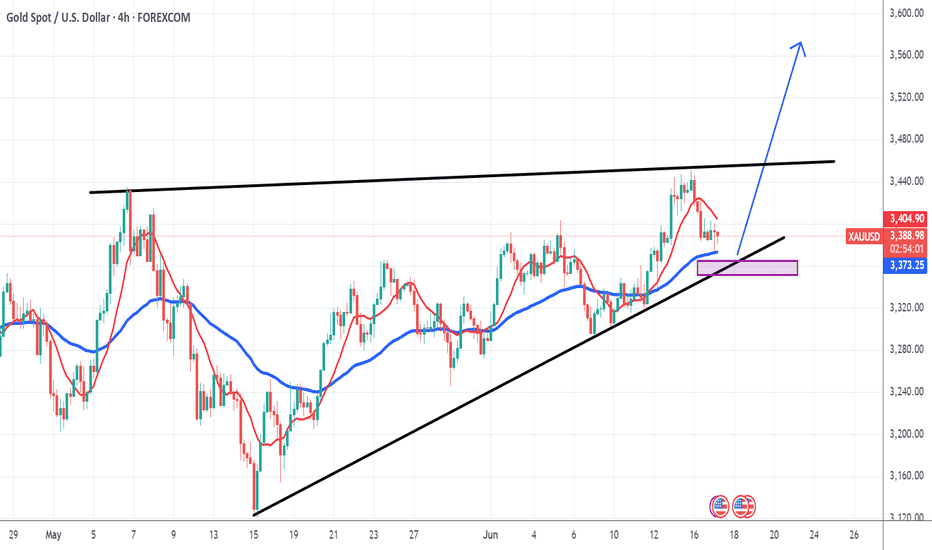
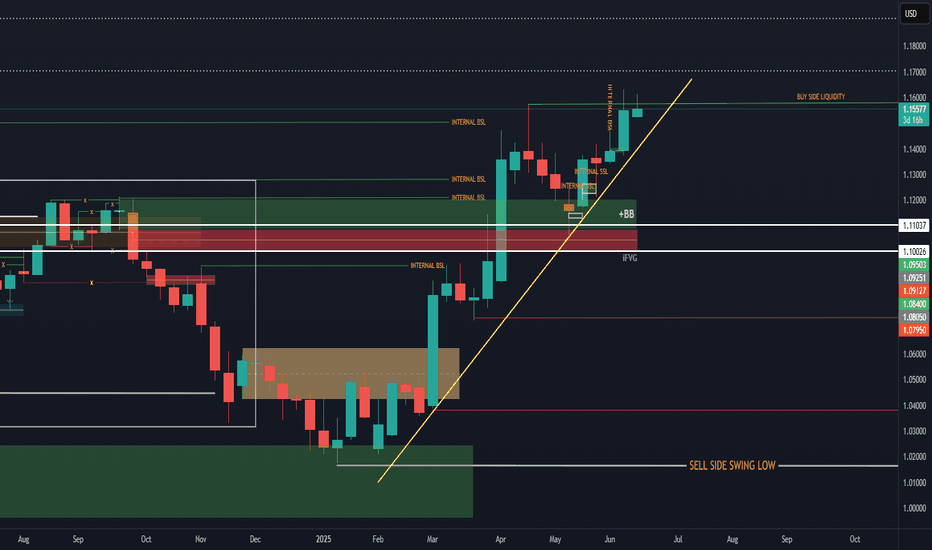
AUDJPYAUDJPY: 10-Year Bond Yields, Interest Rates, Bank Lending Rates, and Carry Trade Advantage (June 2025)
1. 10-Year Government Bond Yields
Australia (AUD):
The 10-year Australian government bond yield is currently around 4.48%–4.53%.
Japan (JPY):
The 10-year Japanese government bond yield is about 1.48% as of June 16, 2025.
2. Central Bank Interest Rate Decisions
Reserve Bank of Australia (RBA):
The RBA cut its cash rate by 25 basis points to 3.85% in May 2025, citing progress in reducing inflation and global uncertainties.
Bank of Japan (BOJ):
The BOJ held its key short-term policy interest rate steady at 0.5% at its June 2025 meeting, maintaining the highest level since 2008.
3. Bank Lending Rates
Australia:
The average overdraft bank lending rate is 10.51% as of April 2025.
Japan:
The long-term prime bank lending rate is 2.05% (April 2025), while the average commercial bank lending rate is reported at 1.625% as of February 2025.
4. Interest Rate Differential
Policy Rate Differential:3.85%3.85% (RBA) − 0.5%0.5% (BOJ) = 3.35%.
10-Year Bond Yield Differential:4.48%4.48% (Australia) − 1.48%1.48% (Japan) = 3.00%.
5. Carry Trade Advantage
Mechanism:
Investors borrow in the low-yielding Japanese yen (JPY) and invest in higher-yielding Australian dollar (AUD) assets, profiting from the interest rate differential.
Current Advantage:
The wide gap in both policy rates and bond yields makes AUDJPY one of the most attractive carry trade pairs in 2025. The 3.35%–3.00% differential offers steady potential returns, especially in a stable or risk-on market environment.
Risks:
If global risk sentiment deteriorates, the yen can strengthen rapidly as a safe haven, unwinding carry trades.
Sudden shifts in RBA or BOJ policy could narrow the differential and reduce the carry trade's appeal.
6. Summary Table
Factor Australia (AUD) Japan (JPY) Differential / Impact
10Y Bond Yield 4.48–4.53% 1.48% 3.00% (AUD advantage)
Policy Rate 3.85% 0.5% 3.35% (AUD advantage)
Bank Lending Rate 10.51% 1.625–2.05% AUD much higher
Carry Trade Outlook High yield, attractive Low yield, funding Strong incentive for AUDJPY long
Conclusion
The AUDJPY pair is strongly supported by a wide interest rate and bond yield differential, making it a favored target for carry trade strategies in 2025. The RBA’s relatively high rates and the BOJ’s ultra-low rates, combined with stable economic conditions, provide a consistent yield advantage for investors holding long AUDJPY positions. However, traders should monitor global risk sentiment and central bank policy shifts, as these can quickly change the carry trade landscape
Community ideas
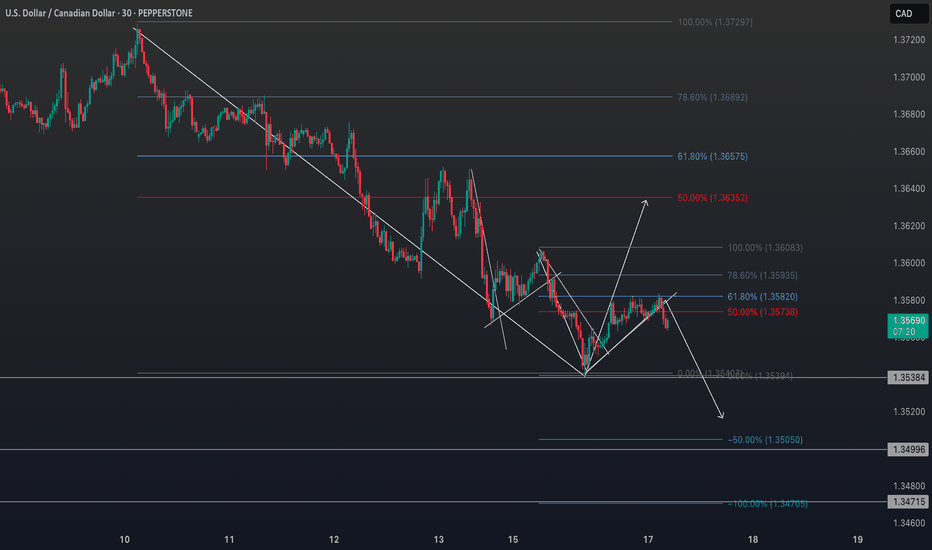
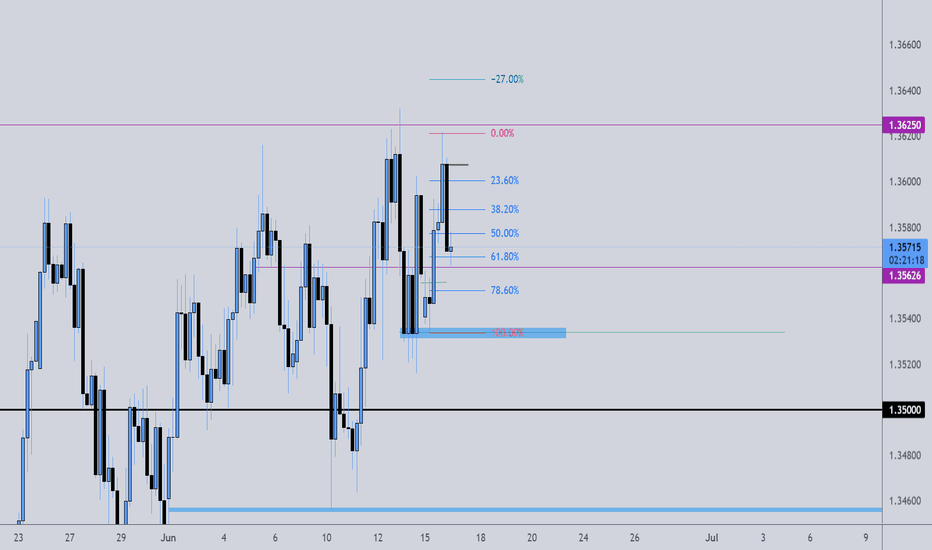
USDCAD Bearish Bias: Beware Liquidity Traps & Reversal Risks.I'm currently keeping a close eye on USDCAD, which has been in a strong bearish trend. 📉
In this video, I explain how the market is unfolding across both the higher and lower timeframes, and why it’s critical to watch them in conjunction. On the lower timeframes, we often see a clean sequence of lower highs and lower lows, as the algos set up a seemingly a smooth trend. But traders should be cautious ⚠️
Why? Because on the higher timeframes, the market can easily pull back, triggering a liquidity hunt. This is often when the algorithm targets stop orders above recent highs, before resuming the trend 🧠💥
While my bias remains bearish, I'm also aware of the risk that the market could shift gears unexpectedly to run stops and shake out weak hands. This concept is fully broken down in the video — with examples of how to spot these traps and prepare accordingly 🎯
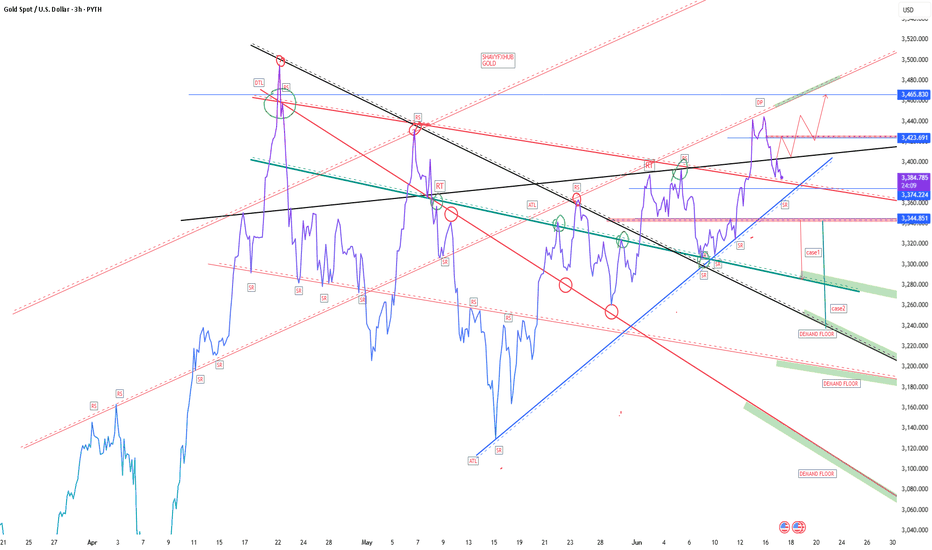
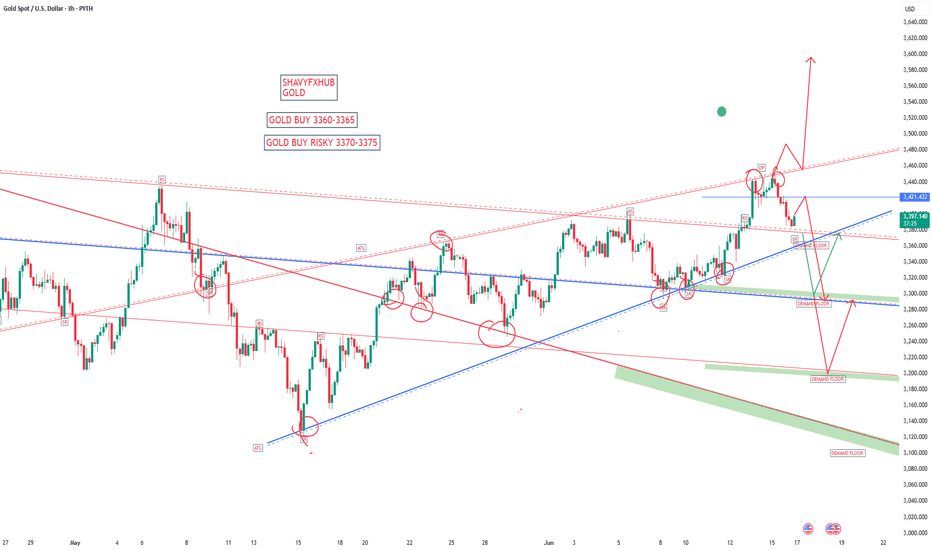
GOLD GOLD brokers have different intraday candle closes which will affect your buy sell decision since we analysis chart based on structure ,multiple brokers charting is key to winning in the market and keep in mind that the 10 year bond yield chart and dxy should be in the picture too..
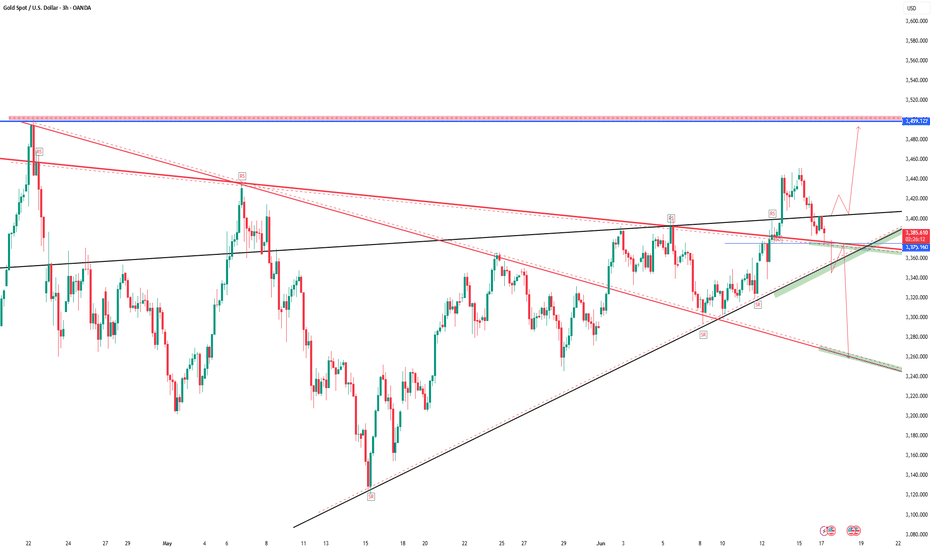
,the price action on 3hr shows that GOLD trading between demand and supply trendline line ,we have taken advantage of retest at 3373-3375 broken descending trendline and on the retest 3373-3375 activated . but 3403-3398 remains higher intraday day 3hr timeframe supply zone coming as a black ascending trendline. If buyers wont break it, they will continue to sell from that level ,if they start selling and break the current ascending trendline ,i will be waiting at the next demand floor 3342-3347floor and the next floor will be to retest the descending trendline breakout connecting 3500-3438-3365 breakout and that will be 3261-3265 demand floor .
goodluck
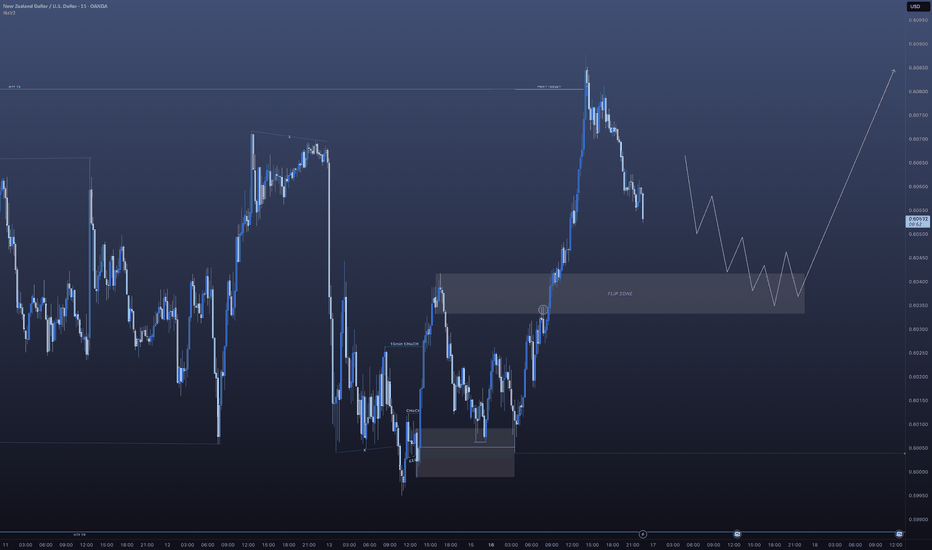
NASDAQ 100 Bullish Breakout Potential: What to Watch NextI'm currently monitoring the NASDAQ 100 (NAS100) very closely. Building on yesterday’s outlook, we've now seen a clear bullish structural shift — price is holding firm above a recent higher high and higher low, suggesting the early stages of a potential trend continuation 📈
Zooming into the 30-minute chart, we can track price action more precisely. I’m watching for a decisive break above the current range high on this timeframe. If we get the break → retest → rejection pattern, this would confirm bullish momentum and provide a long opportunity 🚀
Should this scenario play out, we could also see JPY pairs strengthen to the upside, as a risk-on sentiment flows through the markets 🧭
🔍 This setup is developing — as always, patience and precision are key.
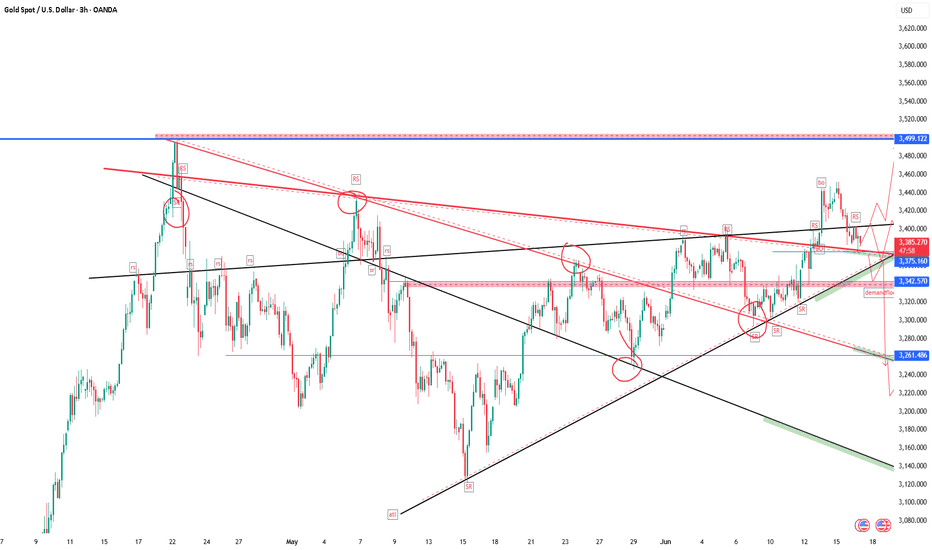
GOLD GOLD ,the price action on 3hr shows that GOLD trading between demand and supply trendline line ,we have taken advantage of retest at 3373-3375 broken descending trendline and on the retest 3373-3375 activated . but 3403-3398 remains higher intraday day 3hr timeframe supply zone coming as a black ascending trendline. If buyers wont break it, they will continue to sell from that level ,if they start selling and break the current ascending trendline ,i will be waiting at the next demand floor 3342-3347floor and the next floor will be to retest the descending trendline breakout connecting 3500-3438-3365 breakout and that will be 3261-3265 demand floor .
goodluck.
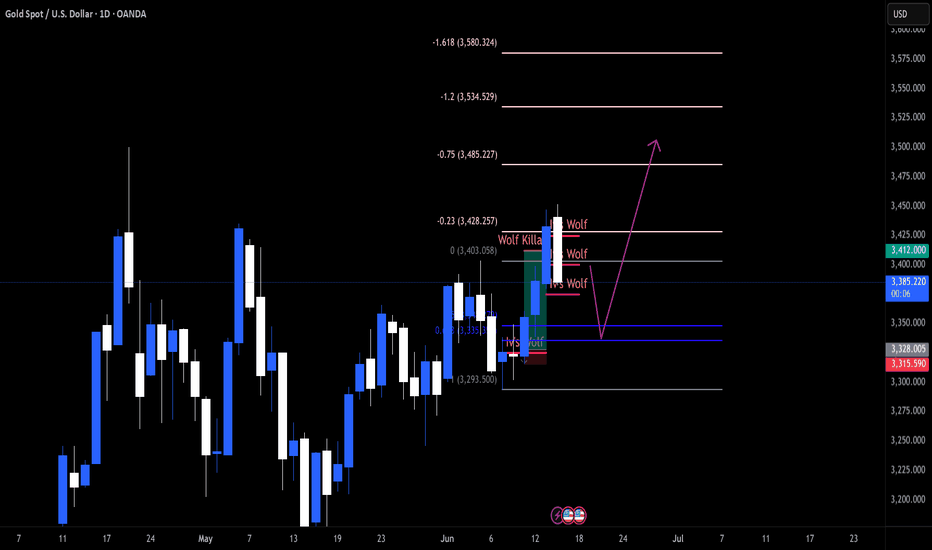
Gold Weekly Outlook – 17 June 2025Gold Weekly Outlook – 17 June 2025
Gold has been trading within a tight range over the past few weeks, repeatedly finding support along its upward trendline.
The ongoing conflict in the Middle East is expected to be a key driver for gold prices in the coming weeks.
Monday’s trading saw gold drop by over 700 pips amid escalating tensions in the region. This “flash crash” may well clear the path for bulls to regain control and push the yellow metal toward new all-time highs.
For now, we remain on the sidelines, waiting to see how price reacts around the 3,360 level, which could serve as a launchpad for a bullish reversal.
Market Review ( DXY & GOLD & EQUITIES & CURRENCIES ) 2025-06-17DXY:
Prediction: Continued bearish pressure, targeting your swing target of 95.00. The fundamental backdrop of potential Fed rate cuts and ongoing geopolitical uncertainty weighing on safe-haven demand for the dollar supports this outlook.
Recommendation: SELL on rallies. Traders should look for opportunities to short the DXY, utilizing resistance levels around 98.50-99.00 for entry. Long-term investors should consider reducing USD exposure in their portfolios.
GOLD:
Prediction: Strong bullish momentum to continue, with a high probability of reaching and exceeding your swing target of 3600. The confluence of safe-haven demand and a weakening dollar provides a powerful tailwind.
Recommendation: BUY on dips. Swing traders can look for pullbacks to key support levels for entry, while long-term investors should consider accumulating gold as a hedge against market volatility and currency depreciation.
THE PILLARS OF PRICE ACTION - This is what I look for!!!!All the information you need to find a high probability trade are in front of you on the charts so build your trading decisions on 'the facts' of the chart NOT what you think or what you want to happen or even what you heard will happen. If you have enough facts telling you to trade in a certain direction and therefore enough confluence to take a trade, then this is how you will gain consistency in you trading and build confidence. Check out my trade idea!!
tradingview.sweetlogin.com
GOLD Gold (XAU/USD), DXY (U.S. Dollar Index), 10-Year Bond Yield, and Interest Rate Correlations
As of June 2025, the relationships between these assets reflect a mix of traditional dynamics and evolving market forces. Below is a breakdown of their correlations and current data:
1. Gold (XAU/USD) and DXY (U.S. Dollar Index)
Traditional Inverse Relationship: Gold is priced in USD, so a stronger dollar (higher DXY) typically makes gold more expensive for foreign buyers, reducing demand and lowering prices. Conversely, a weaker dollar supports gold prices.
Recent Anomaly (2023–2025): Geopolitical tensions (e.g., Iran-Israel conflict, U.S.-China trade disputes) and central bank gold purchases (notably by China and Russia) have driven simultaneous strength in gold and the dollar. For example:
Gold hit a record high of $3,500/oz in April 2025 despite DXY hovering near 98.43.
Central banks bought 1,037 tonnes of gold in 2024, offsetting typical dollar-driven headwinds.
The inverse correlation is reasserting as Fed rate-cut expectations grow, but geopolitical risks still support gold.
2. Gold and 10-Year Treasury Yield
Inverse Correlation Typically: Higher yields increase the opportunity cost of holding non-yielding gold.
Inflation Hedge Exception: When real interest rates (nominal yield - inflation) are negative or low, gold rises despite higher yields. For example:
10-year yield: 4.450% (June 2025)
U.S. inflation: 3.1% (May 2025) → real rate ~1.26%, reducing gold’s appeal but not eliminating it.
Current Driver: Market focus on Fed policy (potential cuts) and inflation persistence keeps gold supported even with elevated yields.
3. DXY and 10-Year Treasury Yield
Positive Correlation: Higher yields attract foreign capital into U.S. bonds, boosting dollar demand (DXY↑).
Divergence Risks: Geopolitical tensions can decouple this relationship (e.g., safe-haven dollar demand outweighs yield changes).
4. Interest Rates and Gold
Fed Policy Impact: Higher rates strengthen the dollar and dampen gold demand, while rate cuts weaken the dollar and boost gold.
2025 Outlook:
Fed funds rate: 4.25–4.50% (held steady in June 2025).
Geopolitical Risks: Safe-haven demand for gold and the dollar persists.
Real Interest Rates: Gold’s performance hinges on whether real rates stay subdued.
Central Bank Demand: Record gold purchases (1,200+ tonnes in 2024) provide structural support.
Conclusion
While traditional correlations between gold, DXY, and yields persist, structural shifts (central bank buying, geopolitical fragmentation) and evolving Fed policy are redefining these relationships. Gold remains bullish in the medium term.
WATCH MY GREEN BAR ZONE FOR BUY.
SPY & MegaCap strengthSPY saw a very strong gap up, negating most of the selling from last week.
despite rising tensions in the middle east - investors have shrugged off volatility and bought the initial dip.
This may be proving that "war" is good for stocks.
we observed a very close correlation between the indices and oil today.
As oil reversed higher - markets saw a bit of weakness. As oil fell markets rallied.
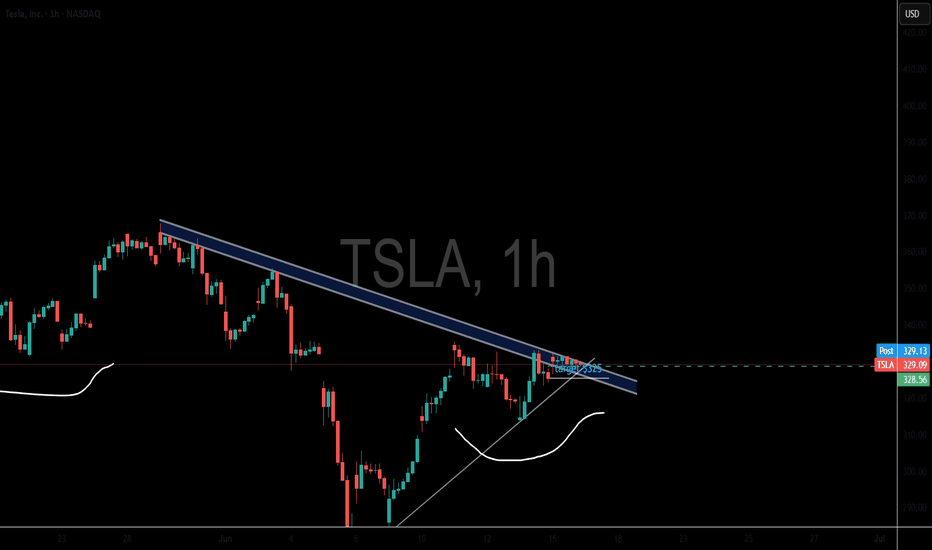
TSLA trying to break a 4 hour bullish pattern
META new Smart Glasses release causing a surge.
MSFT new all time high tap
NVDA firm with ripping semiconductors
GOOGL looking strong for continuation
AMZN moving nicely off support
AAPL lagging the mega's but positive
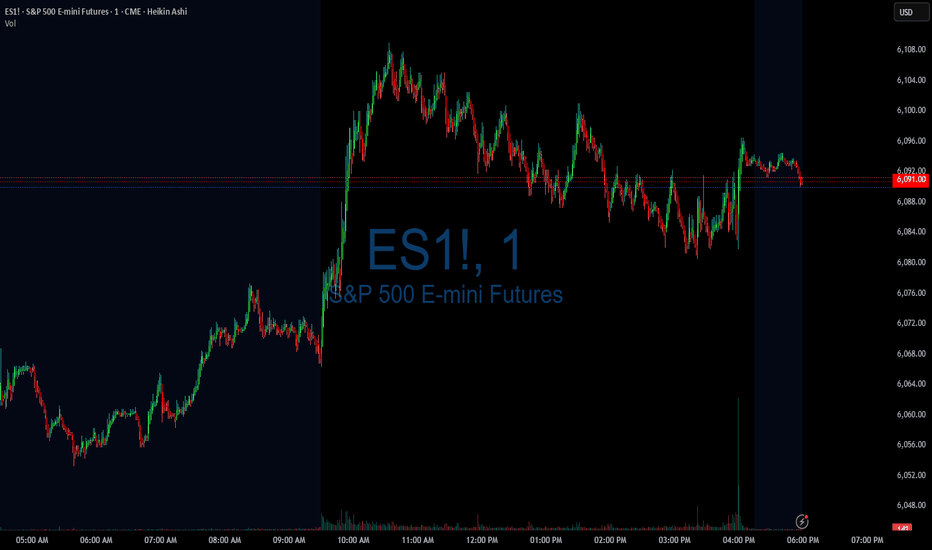
06/16/25 Trade Journal, and ES_F Stock Market analysisEOD accountability report: +450
Sleep: 7 hours
Overall health: Good
What was my initial plan? I knew today was contract rollovers and decided not to trade it, but after noticing that the x1 signals were working pretty good today, i decided to take some plays at the soft support and resistances.
**Daily Trade recap based on VX Algo System from (9:30am to 2pm)**
Lot of X7 buy signals (usual signal that market is bullish)
— 10:40 AM VXAlgo ES X1 Sell Signal (triple signal)
— 11:56 AM VXAlgo ES X3 Sell Signal
— 12:30 PM Market Structure flipped bearish on VX Algo X3!
— 1:20 PM VXAlgo ES X1 Buy signal
Next day plan--> Above 6010 = Bullish, Under 5965= Bearish
Video Recaps -->https://tradingview.sweetlogin.com/u/WallSt007/#published-charts
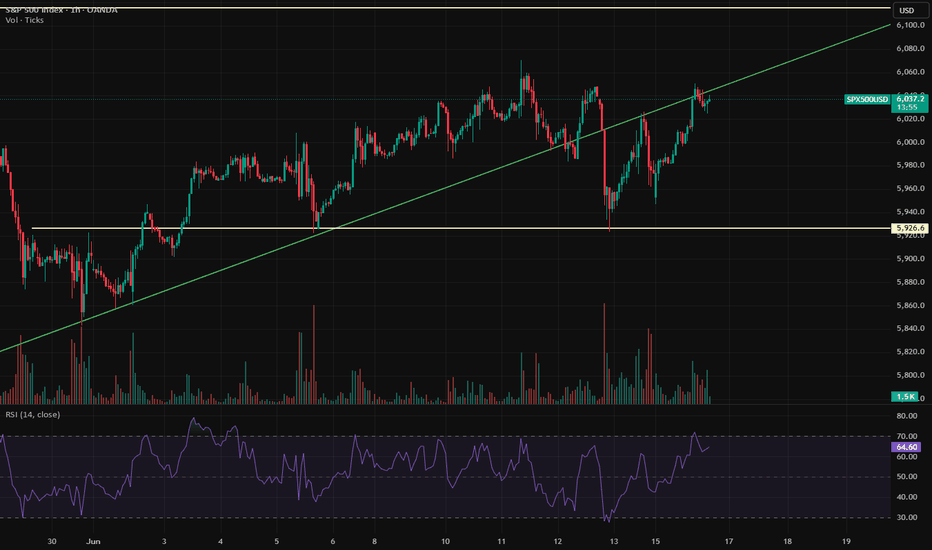
post market ideasSPX rallied into resistance today, so far it's being held back there. Gold looks like a bounce is coming but I don't think it lasts. NG is looking more and more bullish. USOIL found support under 70 and should test the highs from Friday. BTC looks like it could come down a bit here.
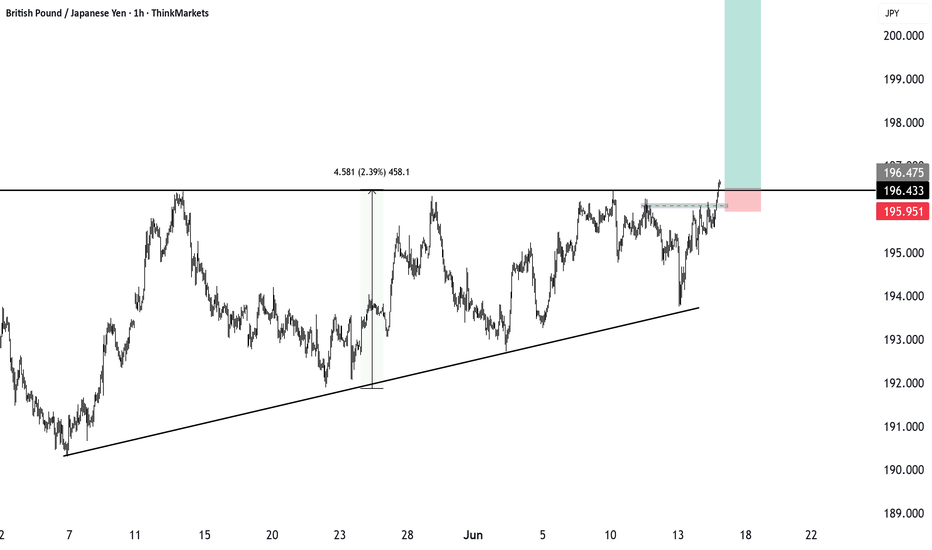
GBPJPY breakout confirmed: what comes next?GBPJPY just triggered an ascending triangle pattern with a 450-pip upside. We dive into the pattern, key levels to watch, and how to manage risk with a 4.8 risk-reward setup. Will it retest before heading higher? Let us know your view in the comments.
This content is not directed to residents of the EU or UK. Any opinions, news, research, analyses, prices or other information contained on this website is provided as general market commentary and does not constitute investment advice. ThinkMarkets will not accept liability for any loss or damage including, without limitation, to any loss of profit which may arise directly or indirectly from use of or reliance on such information.
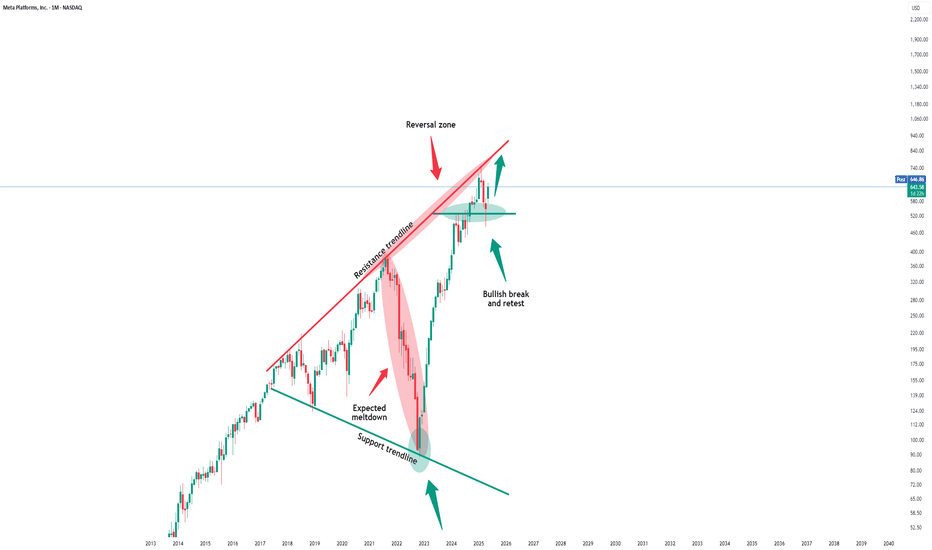
Meta Platforms - The rally is clearly not over!Meta Platforms - NASDAQ:META - can rally another +30%:
(click chart above to see the in depth analysis👆🏻)
Some people might say that it seem counterintuitive to predict another +30% rally on Meta Platforms while the stock has been rallying already about +750% over the past couple of months. But price action and market structure both tell us, that this will soon turn into reality.
Levels to watch: $850
Keep your long term vision!
Philip (BasicTrading)
