Community ideas
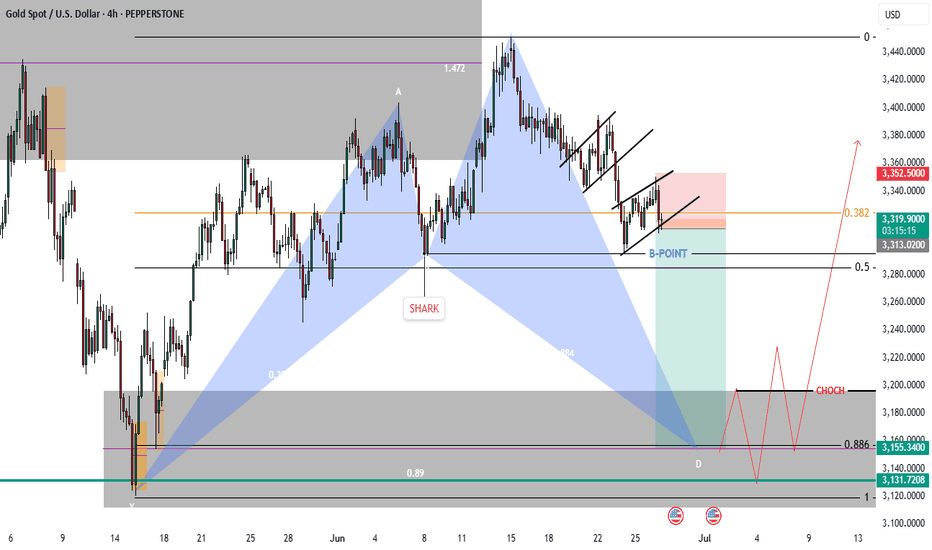
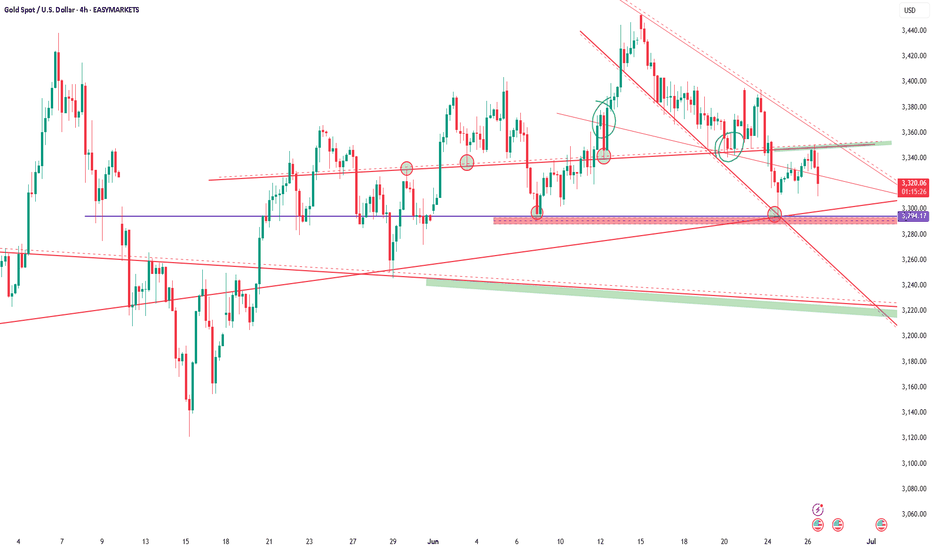
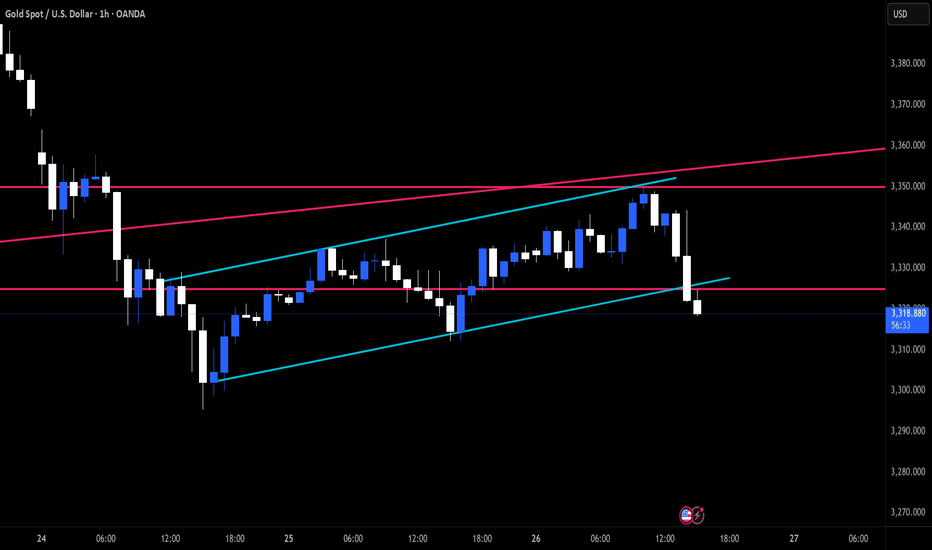
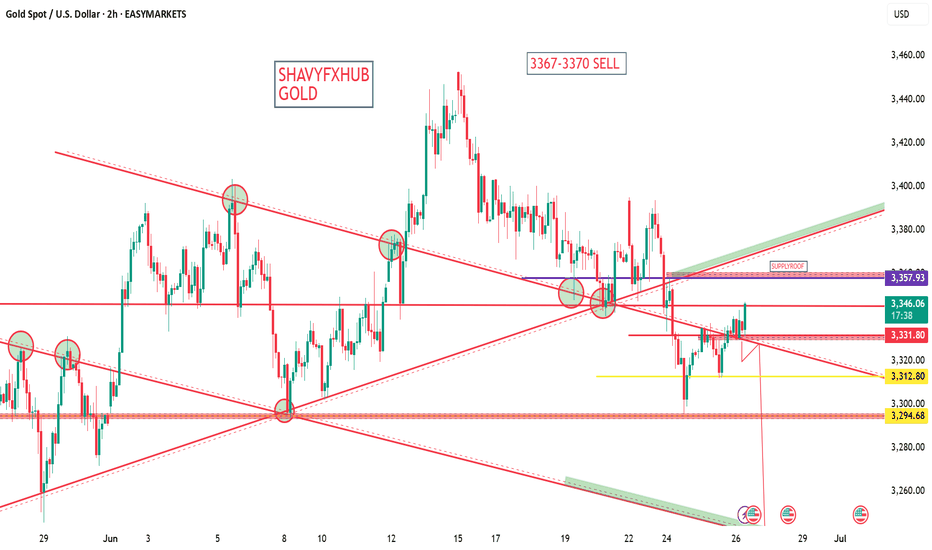
GOLD 1. Final GDP q/q
Actual: -0.5%
Forecast: -0.2%
Previous: -0.2%
The US economy contracted by 0.5% in the first quarter, worse than the expected 0.2% decline, indicating a sharper slowdown than anticipated.
2. Unemployment Claims (Week ending June 21)
Initial Claims: 236,000
Forecast: 244,000
Previous: 245,000
Initial jobless claims fell by 10,000 to 236,000, lower than forecast and near historically low levels, suggesting that layoffs remain relatively subdued despite economic challenges.
Context:
Despite the drop in new claims, continuing claims (people receiving ongoing benefits) rose to about 1.97 million, the highest since November 2021, indicating some softening in the labor market. Economists expect the unemployment rate to edge up slightly to around 4.3% in June from 4.2% in May.
3. Core Durable Goods Orders m/m (May 2025)
Actual: +0.5%
Forecast: +0.1%
Previous: +0.2%
Core durable goods orders, which exclude transportation, rose 0.5% month-over-month, beating expectations and signaling some resilience in business investment.
4. Durable Goods Orders m/m (May 2025)
Actual: +16.4%
Forecast: +8.6%
Previous: -6.3%
Total durable goods orders surged 16.4%, a strong rebound following a prior decline, indicating a pickup in demand for long-lasting manufactured goods.
5. Final GDP Price Index q/q (Q1 2025)
Actual: 3.7%
This measure of inflation in the GDP deflator remains elevated, reflecting persistent price pressures in the economy.
Summary of Market Implications:
The larger-than-expected GDP contraction signals economic weakness, which could increase expectations for accommodative Fed policy.
The drop in initial jobless claims supports the view that layoffs are limited, but rising continuing claims suggest some labor market softness ahead.
Strong durable goods orders point to underlying business investment strength, providing a mixed but cautiously optimistic outlook.
Elevated inflation as shown by the GDP price index keeps inflation concerns alive.
Overall, the data presents a complex picture of a slowing economy with pockets of resilience and ongoing inflationary pressure.
#GOLD
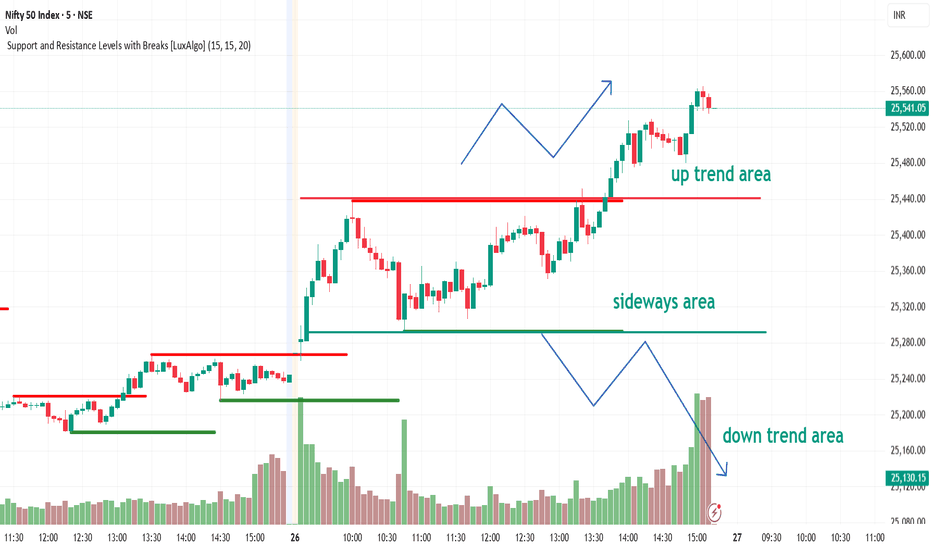
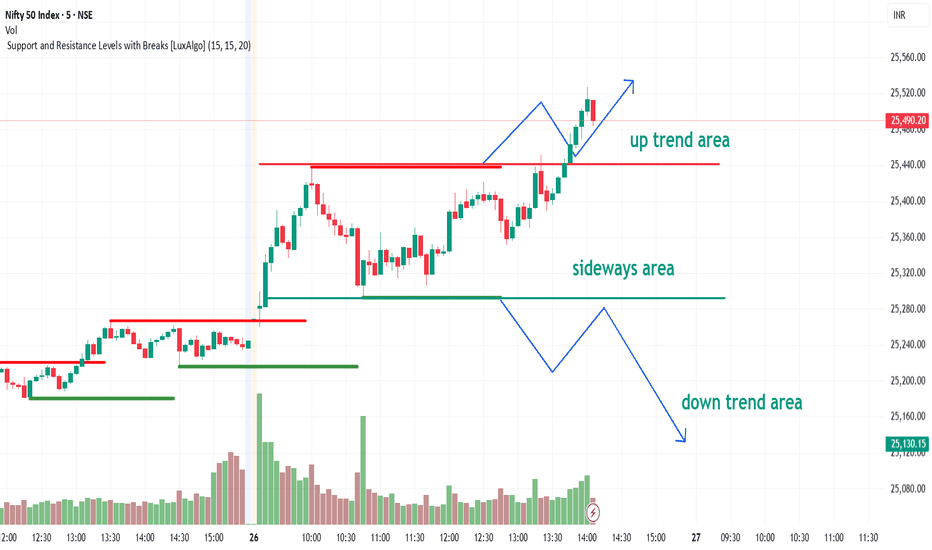
Retest Success + Upside Move = Confirmed BreakoutMarket Sentiment is Bullish
Buyers have stepped in after retest.
Confidence is strong above 25,440.
Next Targets to Watch:
🎯 Target 1: 25,520
🎯 Target 2: 25,600+
These levels could act as minor resistances.
Support Now:
25,440 (was resistance, now support).
Price should ideally stay above this level for trend continuation.
🧠 Suggested Trading Plan (If You’re Active in the Market):
Action Level (Approx.)
Entry (Long) 25,450–25,470
Stop Loss Below 25,420
Target 1 25,520
Target 2 25,580–25,600
📊 Confirmation Tools (Optional for Extra Safety):
Look for strong bullish candles on 5-min/15-min chart.
Volume spike with upward movement confirms smart money involvement.
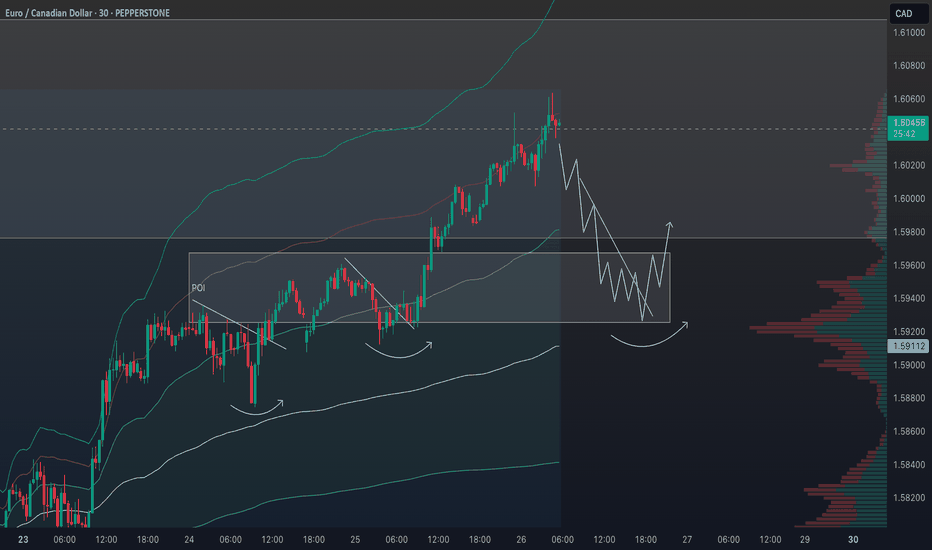
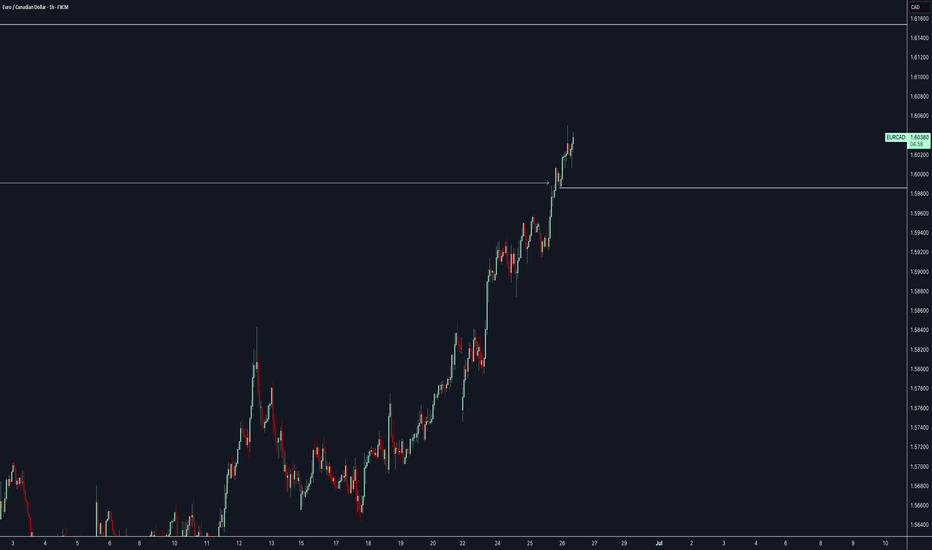
EURCAD Analysis & The Blueprint for a Winning Trading Strategy📍 You’ve got to have a roadmap — a solid trading plan is absolutely essential 🧭.
In this video, I break down my personal trading plan and walk you through exactly how I approach the markets 🎯. I’m currently looking at EURCAD and there’s a lot happening on this chart 📉📊.
First things first: price action is clearly overextended 📈. The question is — do you really want to be buying at a premium? That’s where risk increases significantly ⚠️.
My approach is simple yet effective: I look for signs of reversal or a pullback into equilibrium 🌀 — then I wait for price to break structure before I act 📐.
Having a system in place that alerts you when key conditions are met is critical 🔔. That’s how you build consistency and gain a real edge in the market 🧠⚔️.
In this video, I’ll show you my strategy, how I plan a trade, what I’m looking for, and why patience is key 🧘♂️.
🛑 Don’t chase price. Let the setup come to you. Let the chart reveal its hand 🃏.
Not financial advice — always do your own research. 📚
retest check1. Successful Retest (Bullish Confirmation):
If price touches the breakout level (~25,440) and bounces back up, it confirms strong support.
This is a buying opportunity for traders.
Entry: Near the support level (25,440).
Stop Loss: Just below the support (e.g., 25,400).
Target: Next resistance levels like 25,520 or higher.
❌ 2. Failed Retest (False Breakout):
If price breaks back below 25,440, it can be a false breakout.
Price might re-enter the sideways range or even go into a downtrend.
Traders should avoid long trades or may even consider short positions if it falls below 25,292 (support zone).
📊 What to Watch Now:
Price behavior near 25,440.
Volume: Low volume = weak retest; Strong bounce with volume = bullish.
Candle patterns: Bullish reversal candles (e.g., hammer, bullish engulfing) near 25,440 can confirm upside.
Wait For RetestChart Analysis (Upside Breakout):
✅ Breakout Confirmation:
The price broke above the resistance level around 25,440.
This is a strong sign of a bullish breakout.
🔼 What It Indicates:
Buyers are now in control of the market.
The next possible target or resistance could be around 25,520 or higher (as per the upper levels on the chart).
If the breakout is supported by good volume, it adds further strength to the move.
🧠 For Traders:
It may be a good opportunity to consider long (buy) positions, especially after a small pullback and confirmation.
Stop Loss: Can be placed near the breakout level (~25,440), which now acts as support.
Target: You can aim for the next resistance zones like 25,520, 25,600, etc.
📊 Volume Insight:
There is a noticeable increase in volume during the breakout, which confirms the validity and strength of the move.
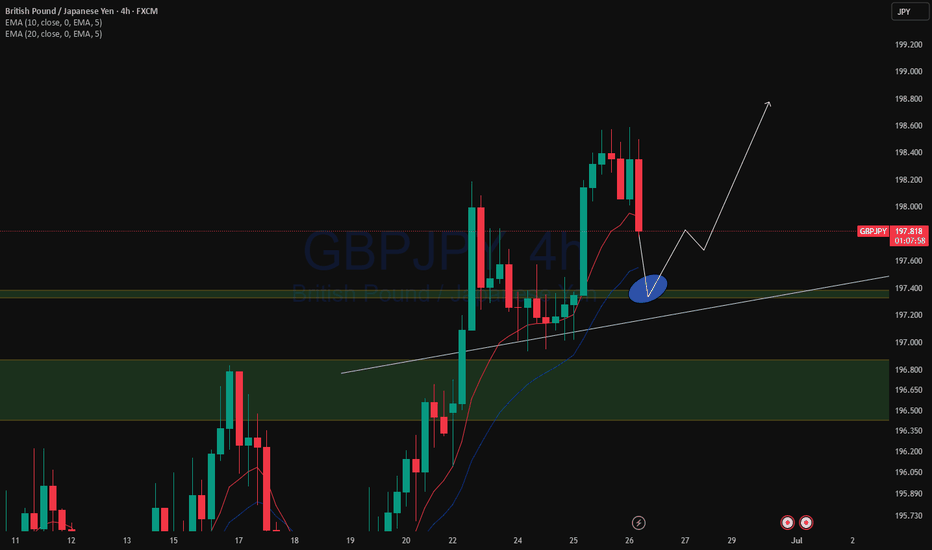
XAUUSD and GBPJPY Analysis todayHello traders, this is a complete multiple timeframe analysis of this pair. We see could find significant trading opportunities as per analysis upon price action confirmation we may take this trade. Smash the like button if you find value in this analysis and drop a comment if you have any questions or let me know which pair to cover in my next analysis.
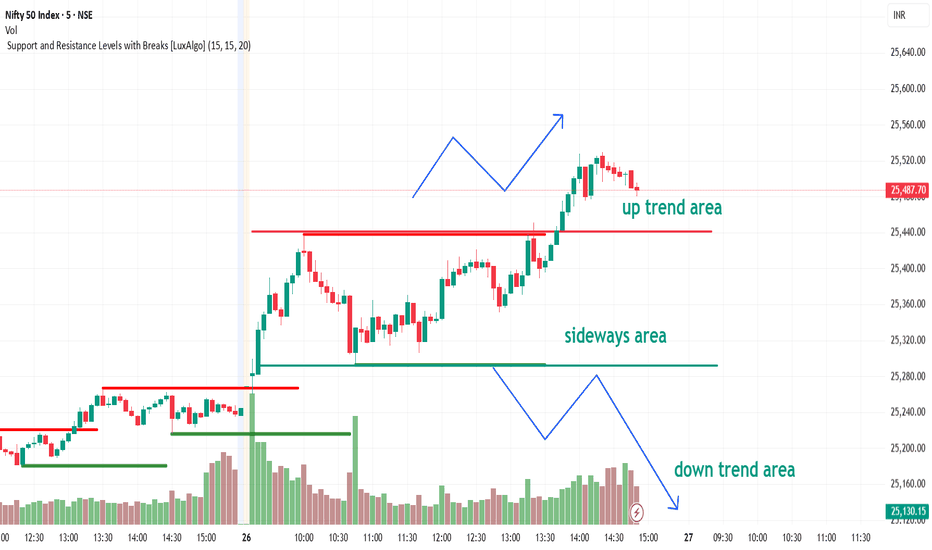
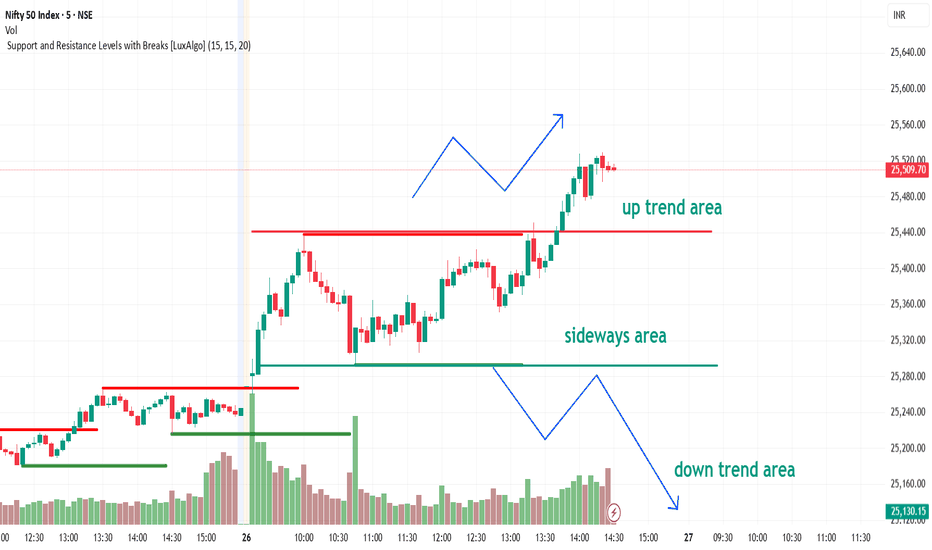
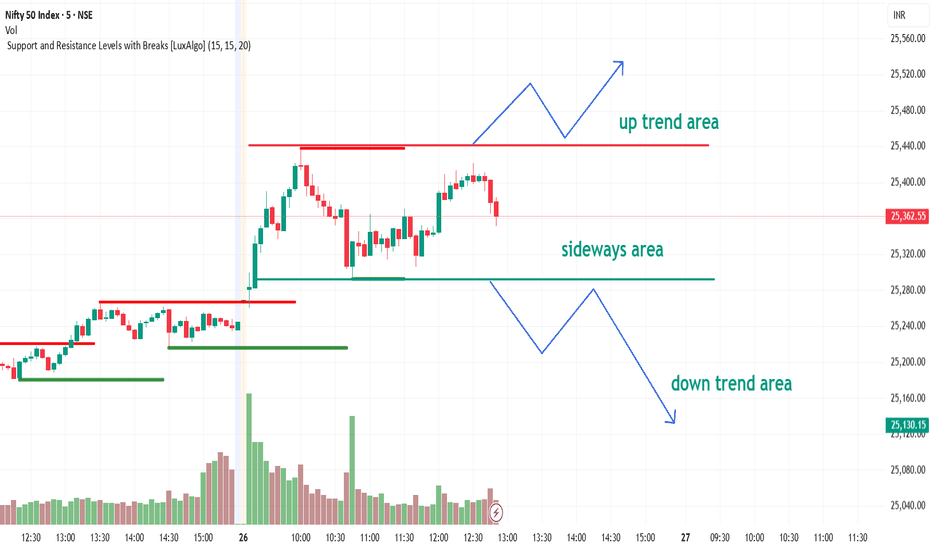
trading strategyUp Trend Area (Above ~25,440):
If the price breaks above the red resistance line (~25,440), it indicates a potential uptrend.
Traders may expect bullish movement and consider buying opportunities above this zone.
Sideways Area (Between ~25,292 and ~25,440):
This range indicates consolidation or indecision in the market.
Price is moving within a range without clear direction.
Traders may wait for a breakout either upwards or downwards.
Down Trend Area (Below ~25,292):
If the price falls below the green support level (~25,292), it may enter a downtrend.
This could signal bearish sentiment and potential selling opportunities.
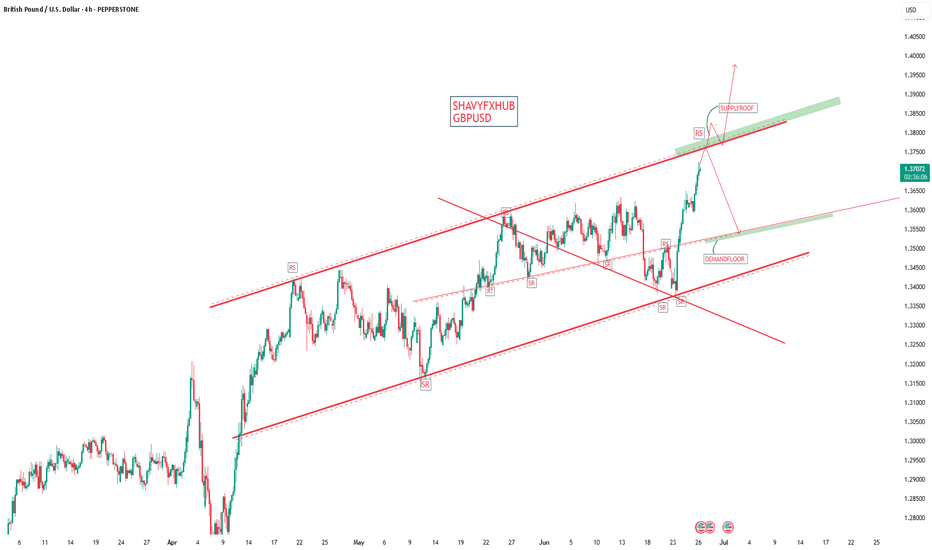
GBPUSD.UK 10-Year Gilt Yield and Interest Rate
UK 10-Year Gilt Yield: The yield stands at 4.48% as of June 25, 2025, after touching a recent high of 4.73%. This elevated yield reflects persistent inflation and cautious market expectations for Bank of England policy.
Bank of England Interest Rate: The current policy rate is 4.25%. Markets expect potential cuts in August and November, possibly bringing the rate to 3.75% by year-end, but the BoE remains cautious due to inflation still above target.
The US dollar is at multi-year lows, pressured by political uncertainty around the Fed, rising expectations for rate cuts, and a broad shift in global risk sentiment away from the dollar
Investors remain cautious due to fiscal policy worries, including the impact of US government spending and debt levels, as well as geopolitical risks.
The market currently prices in two 25-basis-point Federal Reserve rate cuts by the end of 2025, likely in September and December, which influences bond yields.
The 10-year yield is a key benchmark for mortgage rates, corporate borrowing costs, and is often considered the "risk-free rate" in financial valuations
The US10Y stands at 4.29%-4.33%
and interest rate remains 4.25-4.5%
The 10-year yield remains a critical indicator of US economic health, inflation expectations, and monetary policy stance.
#GBPUSD
