Community ideas
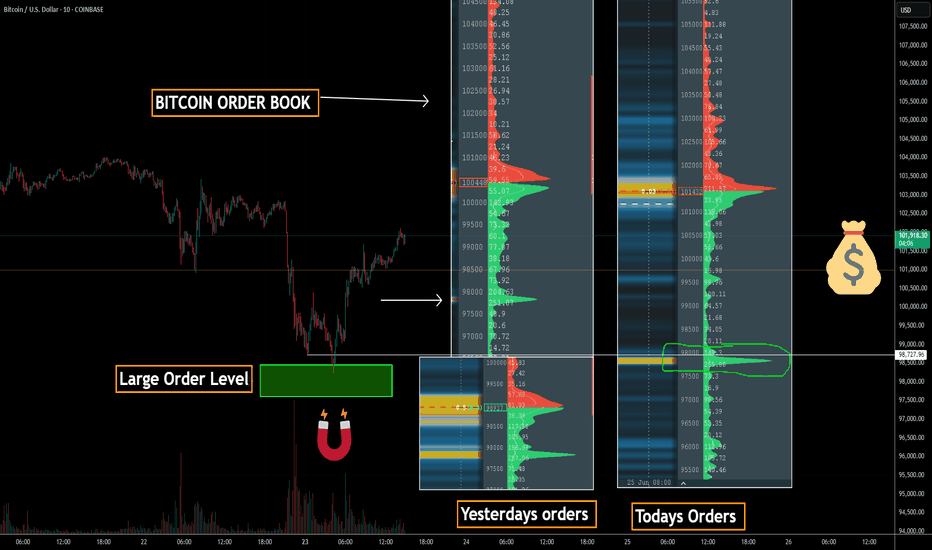
Bitcoin Order Book - How To Trade ItBitcoin Order Book Analysis | Massive BTC Liquidity Zones You Need to Watch
In this video, we break down the Bitcoin (BTCUSD) order book and highlight the biggest buy and sell levels currently driving market sentiment. These are the exact price zones where whales and institutions are placing large orders—often creating powerful support and resistance that can trigger breakout or reversal setups.
In This Breakdown:
• Where major buy/sell walls are forming in the BTC order book
• How order book depth can predict short-term price direction
• Real-time liquidity pockets traders are watching now
• Key price levels to watch for possible long/short entries
This is a must-watch if you’re actively trading BTC and want to track where the smart money is stacking their positions.
⸻
Tools Featured:
• BTCUSD real-time chart
• Order book heatmap / depth
• Liquidity zone visualizations
• Volume profile overlays
• Sentiment Tool
⸻
Use this insight to position your trades around high-probability reversal or breakout zones. Comment your BTC target below, and follow for daily pro-level crypto insights.
⸻
#Bitcoin #BTCUSD #OrderBookAnalysis #BTCOrderFlow #WhaleActivity #LiquidityZones #CryptoTrading #PriceAction #CryptoTA #BitcoinStrategy
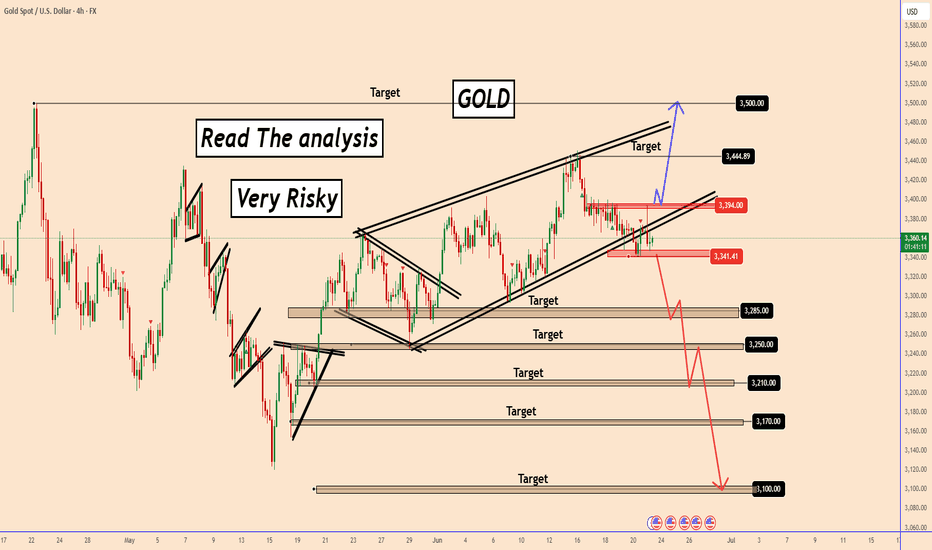
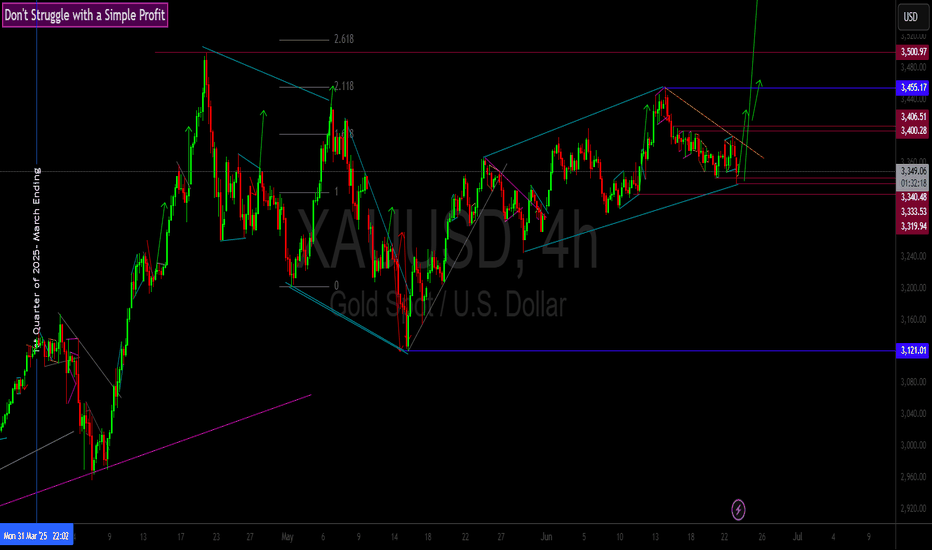
GOLD: In a Very Complex ScenarioGOLD: In a Very Complex Scenario
Gold remains in a highly complex scenario, as price action appears disconnected from current news events.
The absence of bullish volume is concerning and suggests a lack of conviction in the market.
A significant move may unfold precisely when it's least anticipated.
You may watch the analysis for further details
Thank you and Good Luck!
❤️PS: Please support with a like or comment if you find this analysis useful for your trading day❤️
The 4 Pillars of Price Action Trading Explained!!!!!All the information you need to find a high probability trade are in front of you on the charts so build your trading decisions on 'the facts' of the chart NOT what you think or what you want to happen or even what you heard will happen. If you have enough facts telling you to trade in a certain direction and therefore enough confluence to take a trade, then this is how you will gain consistency in you trading and build confidence. Check out my trade idea!!
tradingview.sweetlogin.com
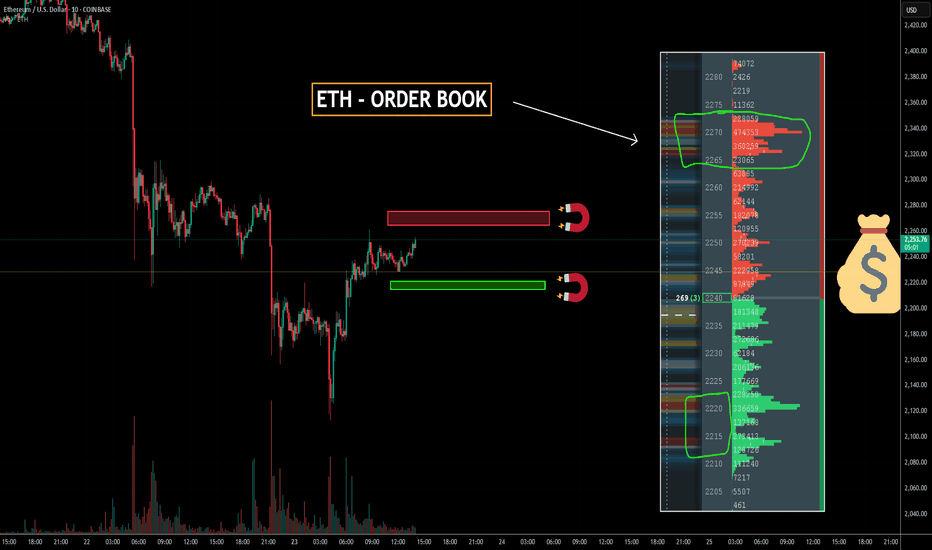
ETH - ORDER BOOK - BIG LEVELS Ethereum Order Book Analysis | Key ETH Levels Revealed (Real-Time Liquidity Zones)
In this video, we dive into the Ethereum (ETHUSD) order book to uncover major liquidity levels that could influence price action in the short and medium term. By analyzing real-time data, we identify where whales and institutions are placing large orders, which often act as strong support and resistance zones.
What You’ll Learn:
• How to spot large buy/sell walls on the ETH order book
• Why these levels matter for short-term traders
• Real-time reactions to major liquidity zones
• Potential long/short trade setups around key areas
This is essential viewing if you’re trading ETH intraday or swing, and want to anticipate where the next major move may come from.
⸻
Tools Used:
• ETHUSD price chart
• Real-time order book data
• Volume heatmaps
• Liquidity zone mapping
• Sentiment Tool
⸻
Stay ahead of the crowd by understanding how the market reacts to big players’ order placements. Don’t forget to leave a comment with your ETH target, and follow for more pro-level crypto analysis.
⸻
#Ethereum #ETHUSD #ETHAnalysis #CryptoTrading #OrderBook #ETHOrderFlow #LiquidityLevels #CryptoTA #PriceAction #WhaleWatching
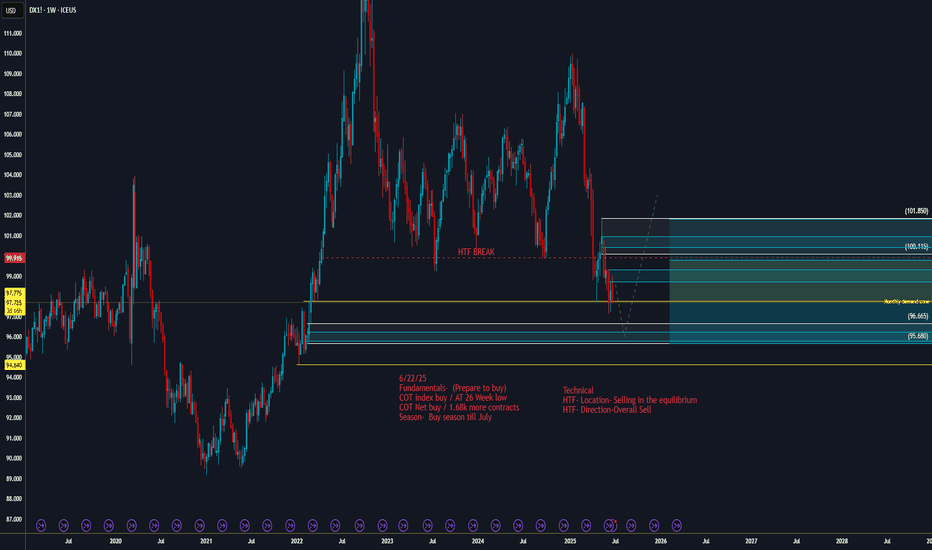
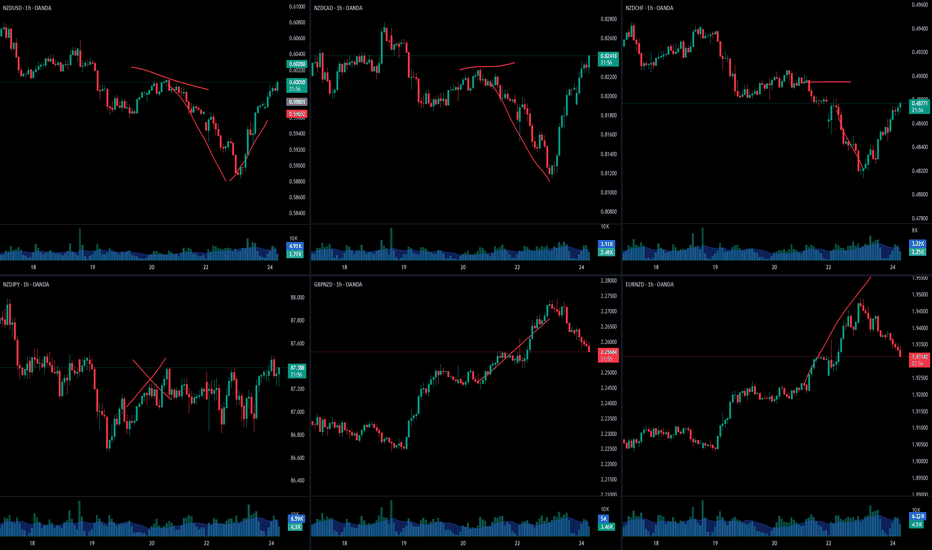
DOLLAR HIT LARGE DEMANDWe may hit the end of the bend. On the larger time frame, we see price retest the double bottom neckline. Last month price developed a doji a huge sign that price might be heading in the opposite direction soon. Fundamentally we see Smart money adding to their contracts and the candles are shortening. Its safe to say that most pairs on the correlated side of the dollar that we can hold our sells until we see price action give us the sign to get out.
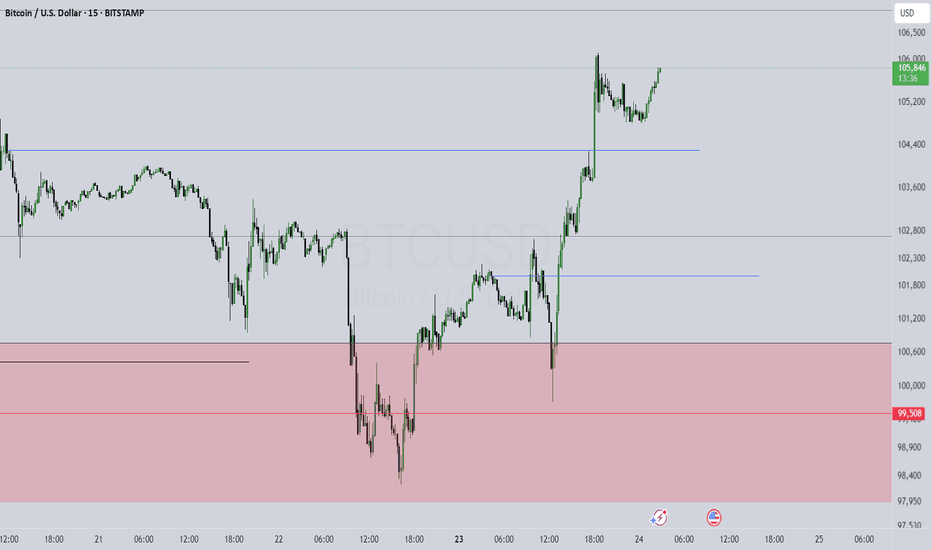
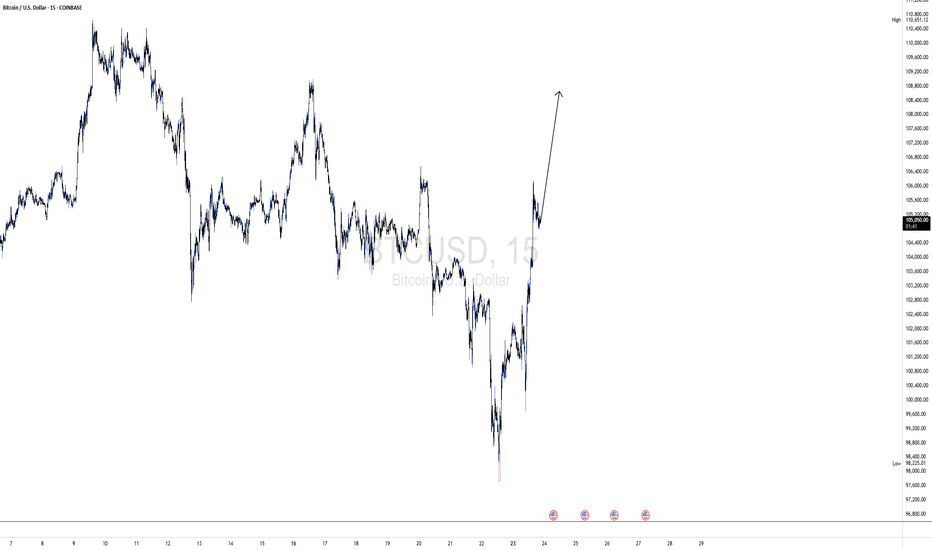
BTCUSDBTCUSD remains in a bullish leg with a projected target at 107,848, aligning with point B of a potential ABCD harmonic structure. Should price reach this level, we will closely monitor for a bearish reversal setup.
From a Smart Money Concepts (SMC) standpoint, we are identifying two key zones of interest for potential short entries:
A newly formed supply zone (order block) at 108,660,
The 107,848 level, corresponding with the anticipated completion of the B leg.
A valid short scenario will require confirmation through SMC triggers — such as a liquidity grab, followed by a break of structure (BOS) or change of character (CHOCH), ideally accompanied by displacement. Upon such confirmation, we will look to initiate short positions with appropriate risk management.
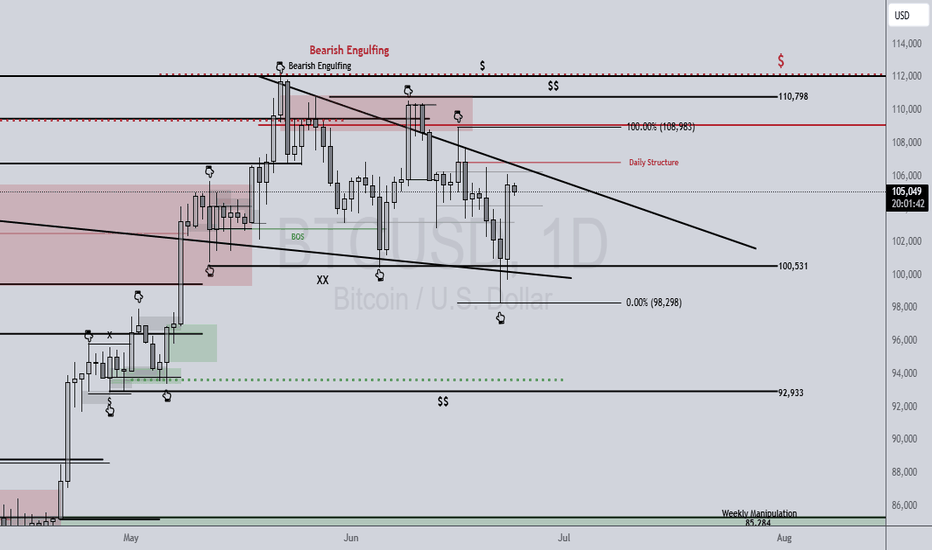
BTCUSD 6/23/2025Come Tap into the mind of SnipeGoat, as he gives you a nice quick analysis of Bitcoins current Price Action to determine Price's next move. THIS IS ONE YOU DON'T WANT TO MISS!
_SnipeGoat_
_TheeCandleReadingGURU_
#PriceAction #MarketStructure #TechnicalAnalysis #Bearish #Bullish #Bitcoin #Crypto #BTCUSD #Forex #NakedChartReader #ZEROindicators #PreciseLevels #ProperTiming #PerfectDirection #ScalpingTrader #IntradayTrader #DayTrader #SwingTrader #PositionalTrader #HighLevelTrader #MambaMentality #GodMode #UltraInstinct #TheeBibleStrategy
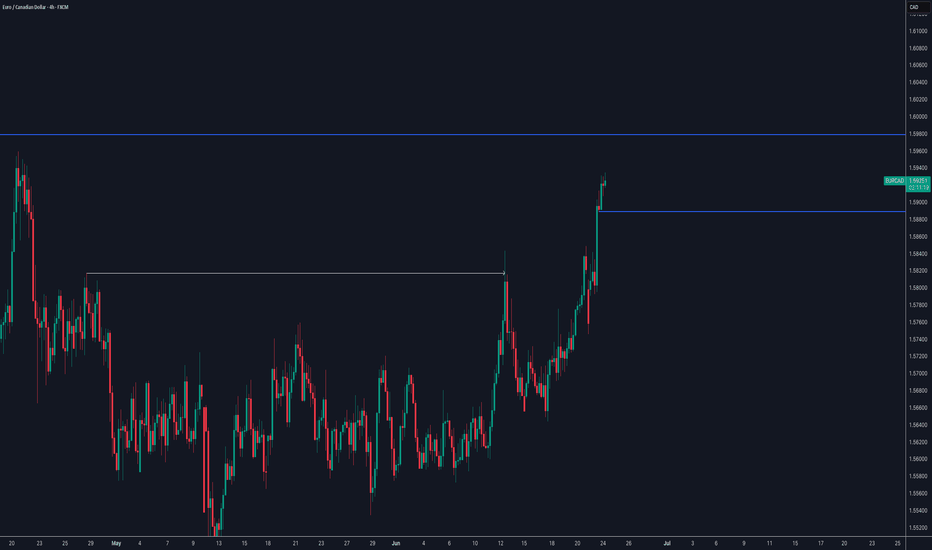
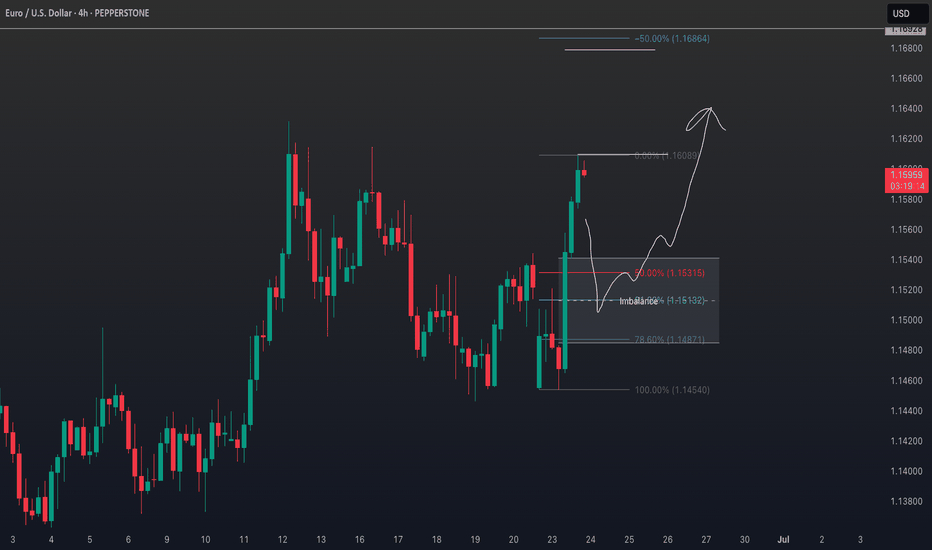
EURUSD Trade Plan: Retracement Into Key Fibo Zone POI.I’m currently watching EURUSD closely 👀. On the daily timeframe, it’s clearly broken structure and is now in a bullish trend 📈. Dropping down to the lower timeframes 🕒, price appears overextended and is now trading into a previous resistance level 🚧.
I’m anticipating a retracement into equilibrium — specifically the 50% level of the current swing, and ideally into the 50–61.8% Fibonacci retracement zone 🔁. If price pulls back into that range, I’ll be watching for a bullish market structure shift 🔄. I don’t want to see it push below the bullish imbalance 📉—I want that zone to hold as support so price can continue north 🔼.
If this plays out, my ideal entry would be around the imbalance and the 50% Fib level, with a stop loss just below the imbalance, and targets set at the current swing high and previous swing high, as detailed in the video 🎯.
⚠️ Disclaimer
This is not financial advice. Trading involves risk and you should only trade with capital you can afford to lose. Please do your own analysis or consult a licensed financial advisor.
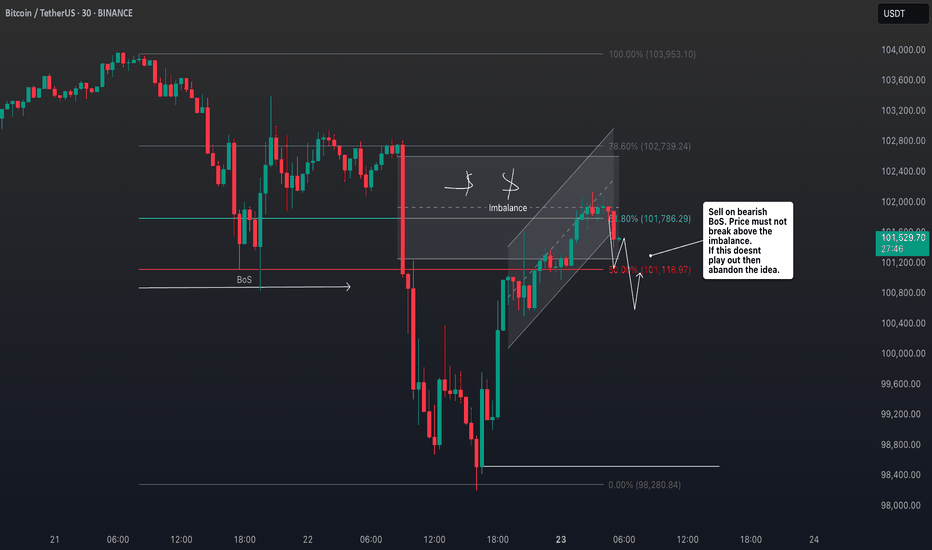
Is Bitcoin Signaling Risk-Off? Structure Breakdown Explained💥 BTC/USD Outlook – Is Bitcoin Losing Steam? 🧠📉
I'm keeping a close watch on Bitcoin (BTC/USD) this week, and the current price action is flashing some key signals.
🔍 Over the past several sessions, BTC has struggled to hold momentum, and we’re now seeing a shift in tone. On the 4-hour timeframe, the market structure is tilting bearish, with a pattern of lower highs and lower lows developing — a classic sign of weakness ⚠️📉.
📐 The most recent downside leg has caused a clear break in structure, and BTC is now retracing back into a potential supply zone, hovering around equilibrium of the recent move. This zone will be critical to watch for signs of seller re-entry.
⏳ On the 30-minute chart, I’m waiting for a decisive shift in structure — a break of local support or a failed rally that confirms bearish continuation. Should that play out, it could signal a high-probability short setup.
🪙 A breakdown in BTC often has broader implications — especially in the risk asset space. If we see weakness here, JPY pairs may strengthen as capital rotates into safer assets 💴🌐.
⚠️ Disclaimer:
This is not financial advice. The information provided is for educational purposes only. Please conduct your own analysis and consult a licensed professional before making any investment decisions. 📚💼
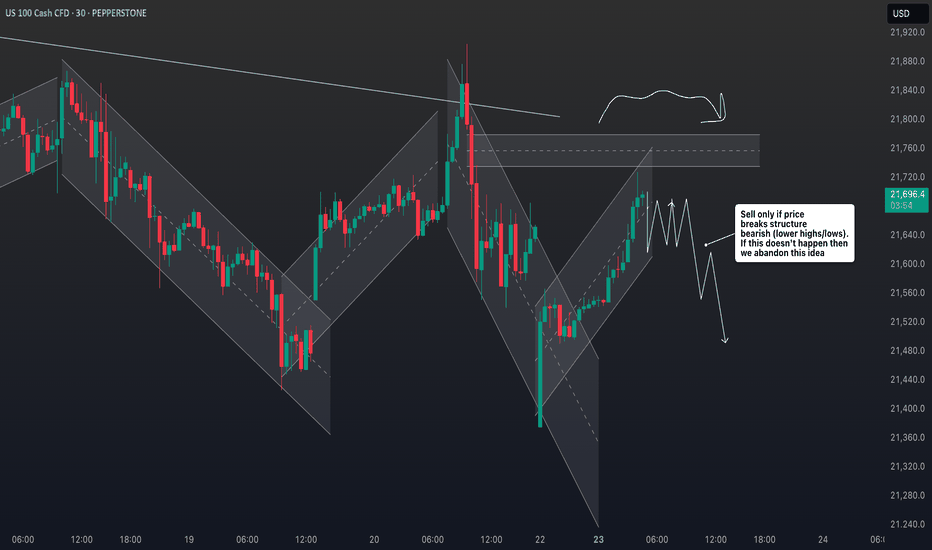
Market Structure Breakdown on NASDAQ: What Traders Should Watch📉 NASDAQ (NAS100, US100) Analysis 🧠💼
I’m currently keeping a close eye on the NASDAQ (NAS100) — price action is telling a story worth watching.
📆 Last week, the index came under clear pressure, and now on the 4H timeframe, we’re seeing a defined bearish structure with consistent lower highs and lower lows 📉🔻. This recent expansion to the downside has led to a break in market structure (BOS), and price is now pulling back into equilibrium 🔄.
⏳ For now, it’s a waiting game. I’m watching to see if this pullback finds resistance at a premium level and rotates back to the downside, which would present a potential short setup 🎯📊.
🕒 On the 30-minute chart, I’m monitoring for a clear structural shift — a change in momentum that confirms bearish intent. Should the NASDAQ resume its downward move, it could trigger risk-off sentiment, bringing strength into the JPY pairs 💴🚨 as capital flows out of risk assets.
⚠️ Disclaimer:
This analysis is for educational purposes only and should not be considered financial advice. Always conduct your own research and consult with a licensed financial advisor before making any trading decisions. 📚💼
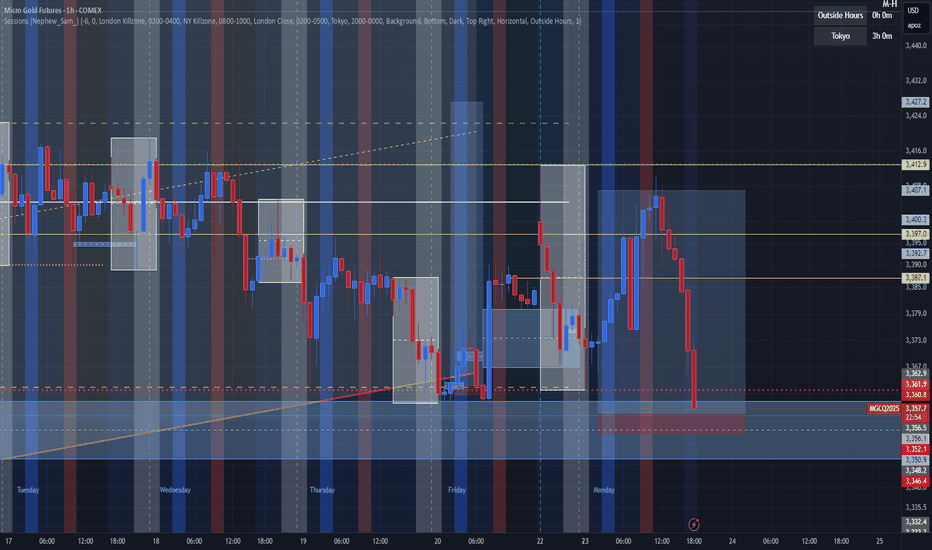
Have we made a Low for the Week yet on Gold???Im looking for price to sweep Monday's low before deciding what it wants to do. I want to see everything line up inside of the killzone to take advantage. Just have to be patient. We still have a lil time so sitting on my hands until it all looks clear to proceed with the move.
06/23/25 Trade Journal, and ES_F Stock Market analysis EOD accountability report: +1128.75
Sleep: 7.5 hours
Overall health: good
VX Algo System Signals from (9:30am to 2pm) 4/4
10:40 AM VXAlgo NQ X1 Sell Signal (double signal):check: 10 pt move
12:00 PM Market Structure flipped bearish on VX Algo X3! :check: 35 pt move
12:43 PM VXAlgo ES X1 Buy signal (triple signal) :check: 20 pt move
1:34 PM Market Structure flipped bullish on VX Algo X3! :check: 23 pt move
What’s one key lesson or takeaway from today?
and What major news or event impacted the market today?
Oil is trading as if the Israel/US-Iran war is over and market can be irrational lol
What are the critical support levels to watch?
--> Above 6060 = Bullish, Under 6050= Bearish
Video Recaps -->https://tradingview.sweetlogin.com/u/WallSt007/#published-charts
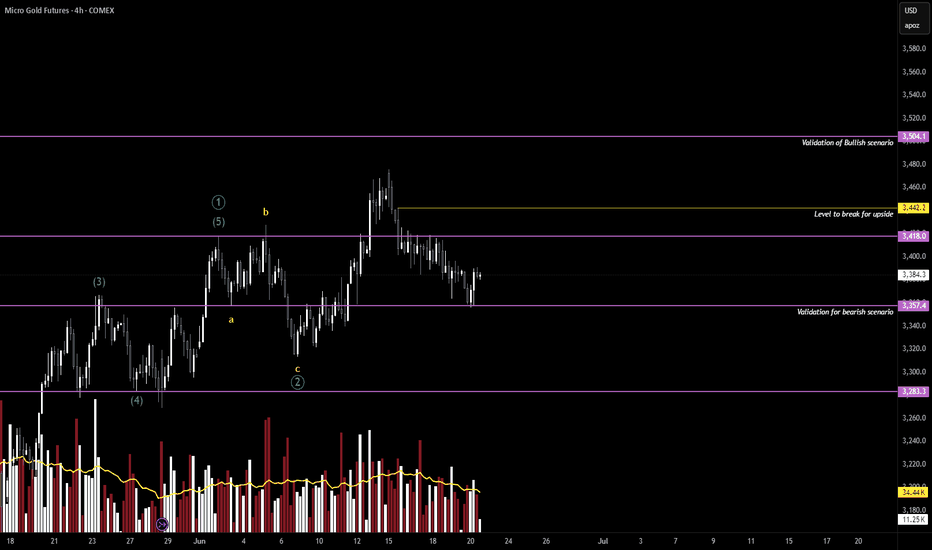
$GC/$MGC/Gold - Weekend UpdateHello Fellow Gamblers,
Gold is currently playing with our feelings. We've been trough these short up and downs this past week but I believe that we are now ready for a reversal. Price had a good bounce from the 3357 support, which broke the minor trendline and is now creating a flag pattern, hinting at a possible continuation.
- We need 3357 to hold and a break of 3418 and 3442 for a continuation up.
- A break below 3357 will bring us back to our bearish scenario.
- Levels to watch: 3283, 3357, 3418, 3504
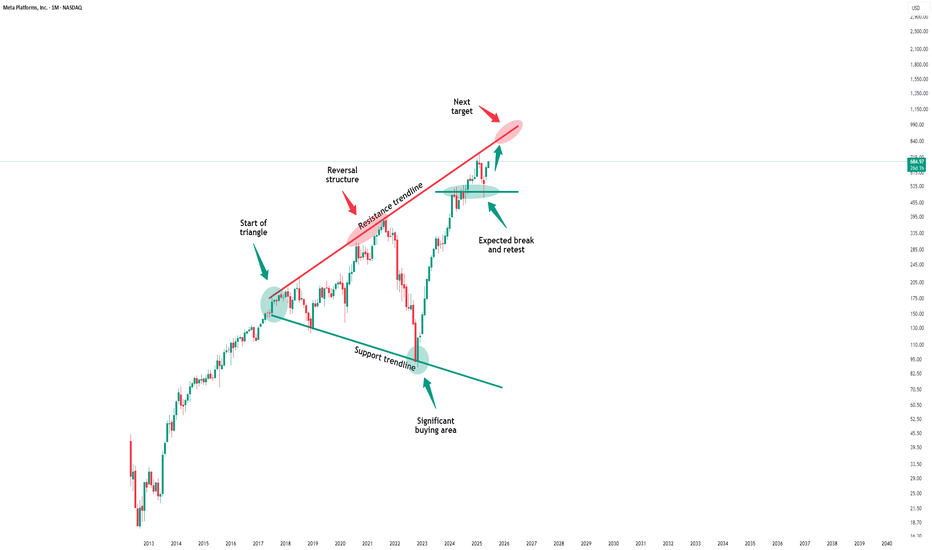
Meta Platforms - This stock tastes sooo good!Meta Platforms - NASDAQ:META - will print a new all time high:
(click chart above to see the in depth analysis👆🏻)
Over the course of the past two months, Meta has been rallying +40%. This recent behaviour was not unexpected at all but rather the consequence of the all time high break and retest. Now - back at the previous all time high - Meta will most likely break out higher again.
Levels to watch: $700, $900
Keep your long term vision!
Philip (BasicTrading)
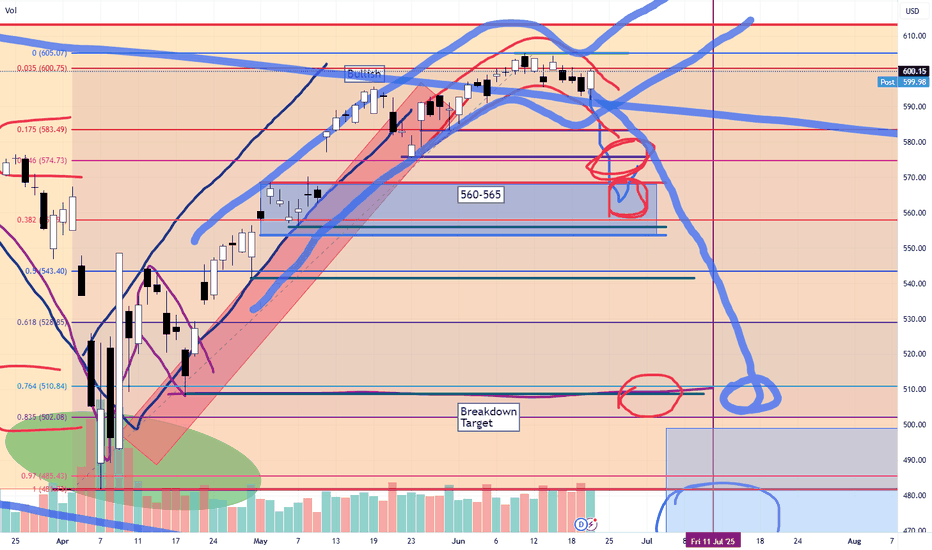
SPY/QQQ Plan Your Trade For 6-23 : Afternoon UpdateWhat happened to the CRUSH pattern?
Everyone wants to know why the CRUSH pattern didn't show up today. Well, I keep telling all of you these SPY Cycle Patterns are based on GANN, Tesla and Fibonacci price structures. They do not take into consideration news, global events, or anything outside of PRICE.
They are predictive - meaning they attempt to predict potential price shapes/patterns weeks, months, and years in advance.
The markets, obviously, are seeking some normalcy after the Iran conflict. I thought the CRUSH pattern would have been a perfect fit for today - but obviously the markets didn't agree.
If you have been following my videos, you know I keep saying the US stock market is acting as a global hedge for risks. Traders are pouring capital into the US stock market as a way to avoid global risk factors.
Traders are also pouring capital into Gold/Silver. Demand for physical metals is through the roof right now.
Time will tell if my Excess Phase Peak pattern plays out as I expect or if we rally to new ATHs.
Obviously, this sideways rollover topping pattern could present a breakaway in either direction.
Again, my patterns are not correlated based on news or other events. They are strictly price-based.
Get some...
#trading #research #investing #tradingalgos #tradingsignals #cycles #fibonacci #elliotwave #modelingsystems #stocks #bitcoin #btcusd #cryptos #spy #gold #nq #investing #trading #spytrading #spymarket #tradingmarket #stockmarket #silver
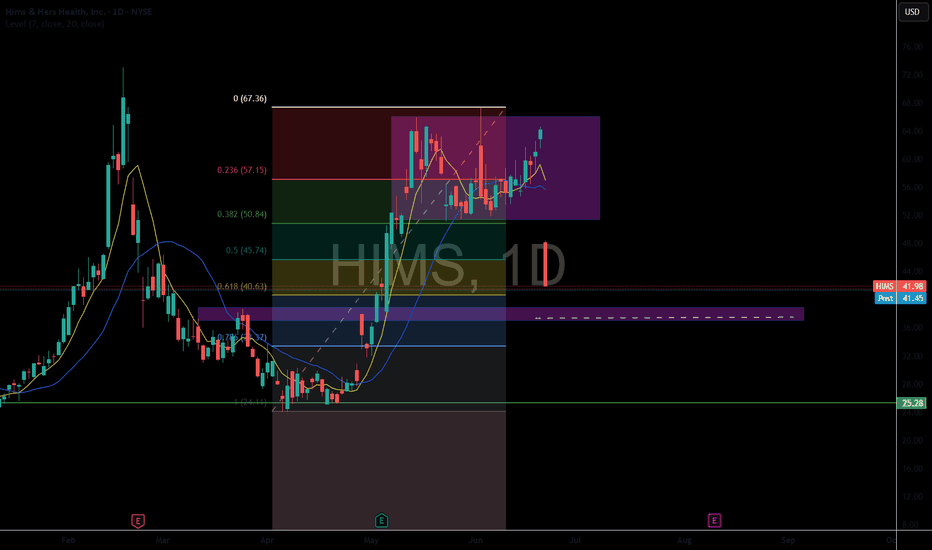
HIMS puked up its Wegovy today!Hims & Hers Health
HIMS
shares were down more than 34.63% in Monday trading, while Novo Nordisk
NVO stock was down over 5% after Novo Nordisk said it has halted its collaboration with Hims & Hers on the sale of weight loss drugs, including Wegovy.
The two companies launched a collaboration in April to bundle Wegovy through Hims & Hers' telehealth platform.
Novo Nordisk said direct access to the drug would no longer be available through Hims & Hers Health because the company "has failed to adhere to the law which prohibits mass sales of compounded drugs under the false guise of 'personalization' and are disseminating deceptive marketing that put patient safety at risk."
This stock failed to catch a bid despite the equity markets strong.
