Community ideas
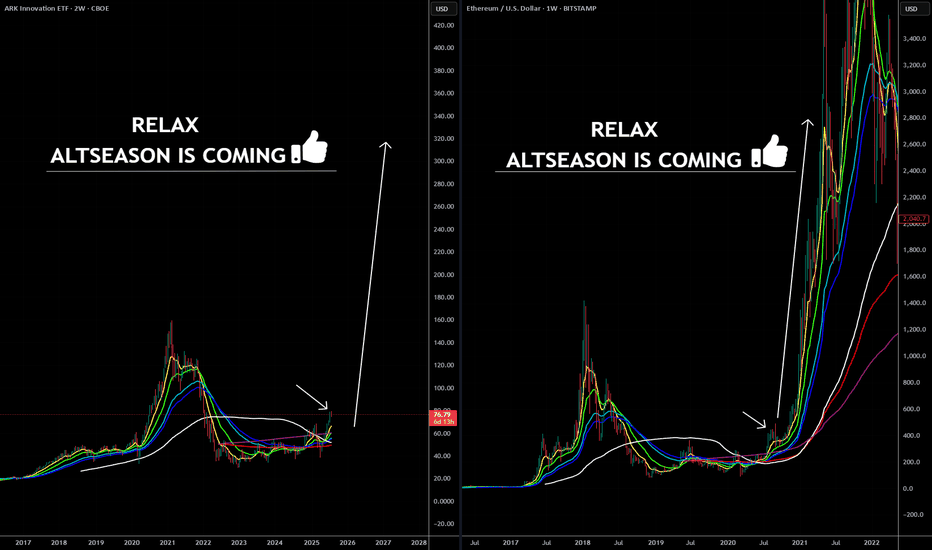
ARKK: The Calm Before the Innovation Storm -ALTSEASON Is COMING🚀 ARKK: The Calm Before the Innovation Storm 🌪️
The markets are shifting, and disruption is about to go vertical. ARK Innovation ETF (ARKK) is quietly positioning itself for what could be the most explosive move of this decade. With high-conviction bets in AI, Bitcoin, genomics, and next-gen tech, this isn’t just a fund—it’s a launchpad for exponential growth.
This post breaks down exactly why ARKK could go parabolic—and why the smart money is already moving in. 👇
Explosive upside in 2026
ARKK is already up over 24% YTD , showing strong momentum compared to broader markets and signaling early stages of a potential parabolic move .
High-conviction concentration in game-changers
Top 10 holdings include Tesla, Roku, Zoom, Coinbase, UiPath, Block, Crispr Therapeutics, DraftKings, Shopify, and Exact Sciences. These are leaders in innovation sectors with massive upside potential .
Deep exposure to Bitcoin and digital assets
Heavy allocation to Coinbase and Block gives indirect exposure to Bitcoin . If BTC breaks into a new cycle high , ARKK stands to benefit significantly.
Positioned in exponential growth sectors
Focus on AI, genomics, EVs, fintech, robotics, and blockchain , all of which are entering accelerating adoption phases globally.
Aggressive smart-money accumulation
Cathie Wood’s team continues buying aggressively during dips, reinforcing institutional confidence in the fund’s long-term trajectory.
Technical breakout structures forming
Ascending triangle and multi-month consolidation breakouts suggest a technical setup primed for explosive upside .
Innovation supercycle aligning
ARKK's themes are aligned with major global shifts like de-dollarization, decentralized finance, and AI convergence .
High beta = massive upside leverage
With a beta above 2 , ARKK tends to outperform in bull runs , offering leveraged exposure to innovation without the need for margin.
Resurgence of top holdings
Names like Coinbase, Tesla, Shopify, and Roku are up 50%–100% YTD , driving ARKK’s NAV growth and fueling bullish sentiment .
Long-term vision with short-term catalysts
The fund projects 5x returns over the next five years , while Bitcoin halving cycles, tech innovation, and regulatory clarity serve as short-term ignition points .
Marty Boots | 17-Year Trader — smash that 👍👍, hit LIKE & SUBSCRIBE, and share your views in the comments below so we can make better trades & grow together!
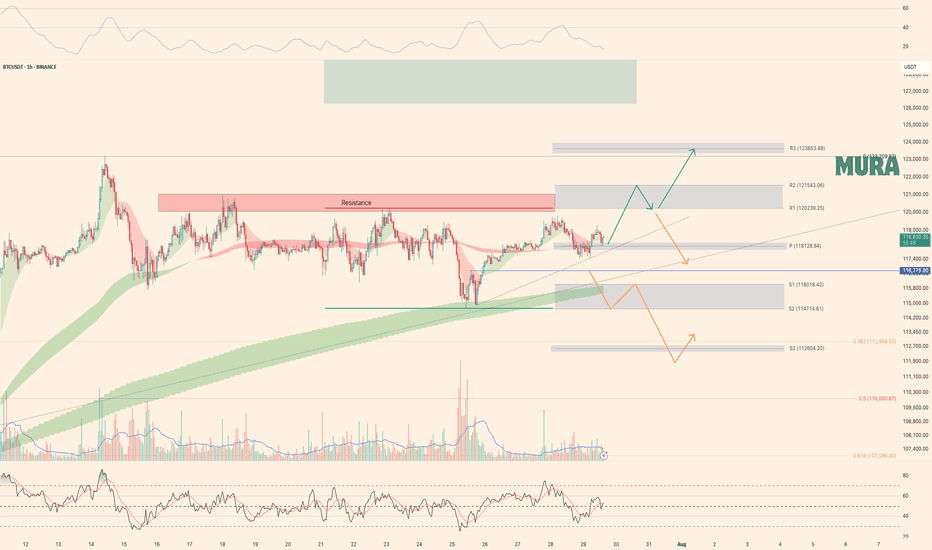
Weekly trading plan for BitcoinLast week price followed our orange scenario. Right now, we're stuck in a sideways correction, and here's what matters:
1. $118K is the big level this week
Stay above it? Good chance we retest ATH
Break below with no recovery? That's trouble
2. If we lose $116,780 next → $112K becomes the target
I've got all the charts and details covered in this video idea—check it out for the full picture!
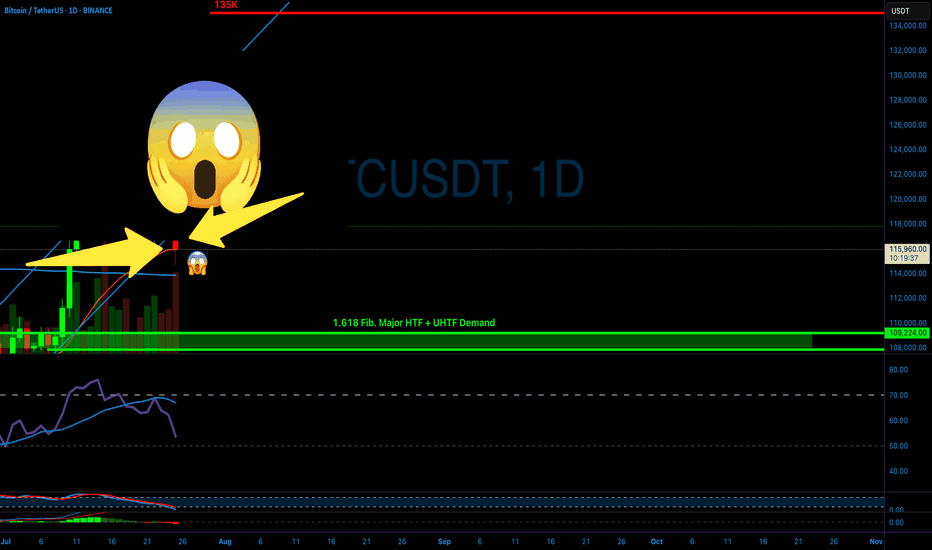
BITCOIN PREDICTION - MASSIVE CANDLE INCOMING!!! (WARNING) Watch this Bitcoin Prediction video now, you will love it!
Yello, Paradisers! Big warning sign: #Bitcoin is about to liquidate more traders soon if we get these confirmations that I'm sharing with you in this video. Loads of people will get wrecked again. Be careful not to get trapped into fakeouts.
In this video, I'm describing exactly what I'm seeing on Bitcoin, what patterns I'm waiting to form, and what confirmations I want to see before being able to say with 100% accuracy guaranteed that MARKETSCOM:BITCOIN is moving in that direction.
I'm sharing with you all the important targets and also how professional trading works: how risk-reward proper ratio trading works, and how high-probability trading depends a lot on how you choose to create your trades.
Watch this Bitcoin prediction to understand what I'm seeing right now on the chart and how I'm acting and making my decisions.
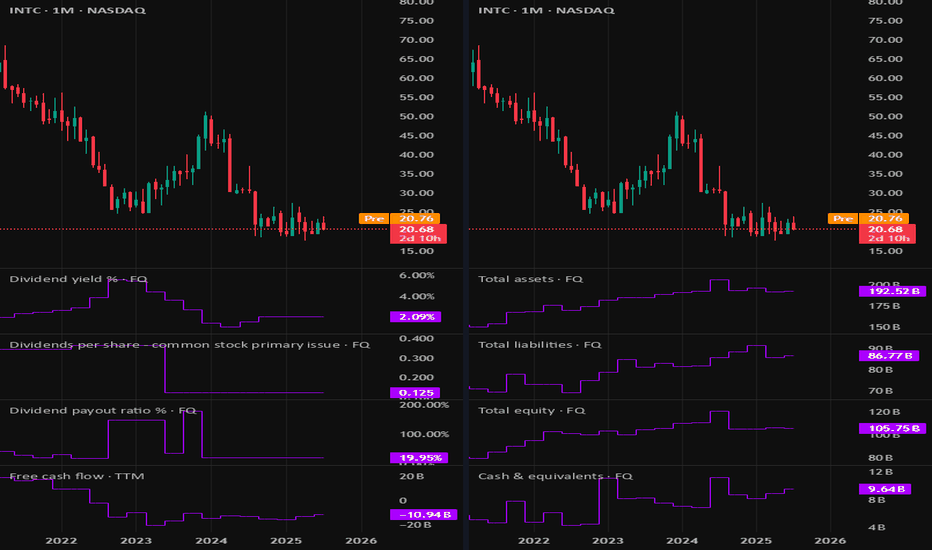
INTC: Intel turnaround will take timeAs we have Intel earnings report released on Thursday, it miss on on EPS, but beat on revenue.
as Intel lag the industry, we still waiting some confirmations of positive turnaround, once we get it, we may get it long from this competitive level since P/B below $1.
Disclaimer: This content is NOT a financial advise, it is for educational purpose only.
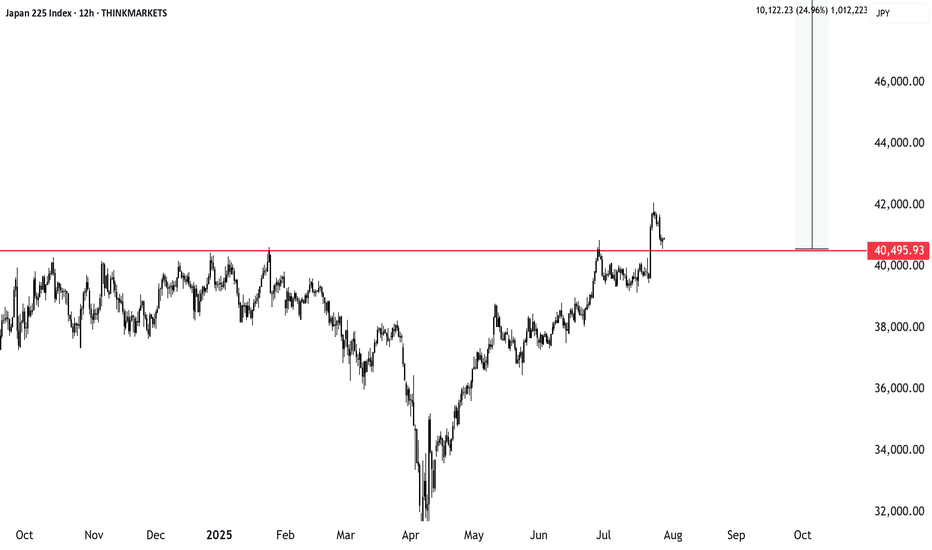
Trading breakouts in summer: Japan’s index pushes higherSummer breakouts are tricky with low market participation, but Japan’s stock index just cleared a major level. Whether it’s a rectangle or inverse head and shoulders, the breakout looks valid. We explore how to manage risk, trim stop losses, and aim for a solid reward ratio. Will this push continue?
This content is not directed to residents of the EU or UK. Any opinions, news, research, analyses, prices or other information contained on this website is provided as general market commentary and does not constitute investment advice. ThinkMarkets will not accept liability for any loss or damage including, without limitation, to any loss of profit which may arise directly or indirectly from use of or reliance on such information.
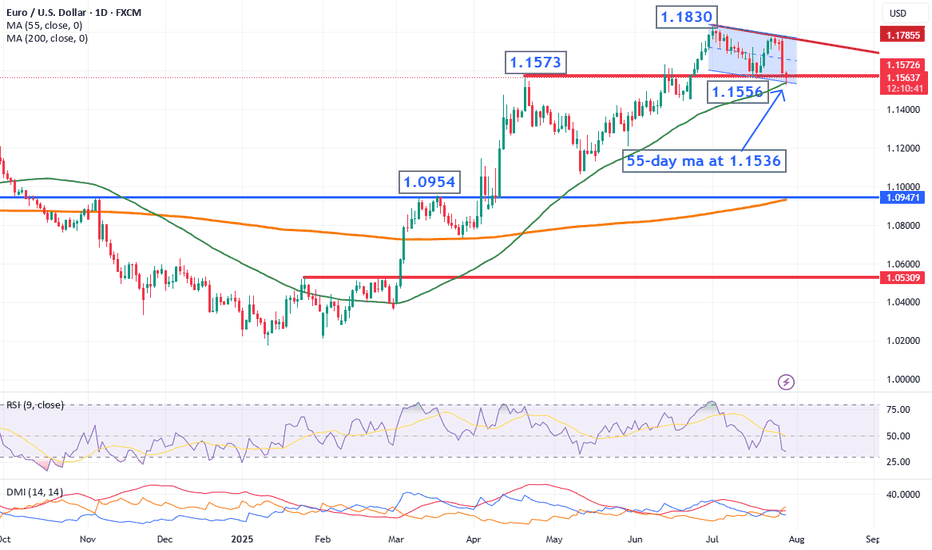
EUR/USD Technical OutlookToday we’re focusing on the euro versus the US dollar, which has recently experienced a sharp sell-off. The move appears directional and is now approaching a key support zone, defined by:
• The April high at 1.1573
• The June low at 1.1556
• The 55-day moving average at 1.1536
A daily close below 1.1536 would be required to confirm further downside momentum.
At present, the pair looks technically vulnerable, having reversed from the top of a 3-year rising channel, with weekly RSI indicators suggesting potential exhaustion. Channel resistance stands around 1.1850.
🔽 Should support fail, we could be looking at a measured move toward the 1.1300 area as a minimum downside target.
This is a critical juncture — we’ll be watching closely for confirmation in the coming sessions.
Disclaimer:
The information posted on Trading View is for informative purposes and is not intended to constitute advice in any form, including but not limited to investment, accounting, tax, legal or regulatory advice. The information therefore has no regard to the specific investment objectives, financial situation or particular needs of any specific recipient. Opinions expressed are our current opinions as of the date appearing on Trading View only. All illustrations, forecasts or hypothetical data are for illustrative purposes only. The Society of Technical Analysts Ltd does not make representation that the information provided is appropriate for use in all jurisdictions or by all Investors or other potential Investors. Parties are therefore responsible for compliance with applicable local laws and regulations. The Society of Technical Analysts will not be held liable for any loss or damage resulting directly or indirectly from the use of any information on this site.
DOLLAR INDEX U.S. Dollar Index (DXY) and US 10-Year Treasury Yield
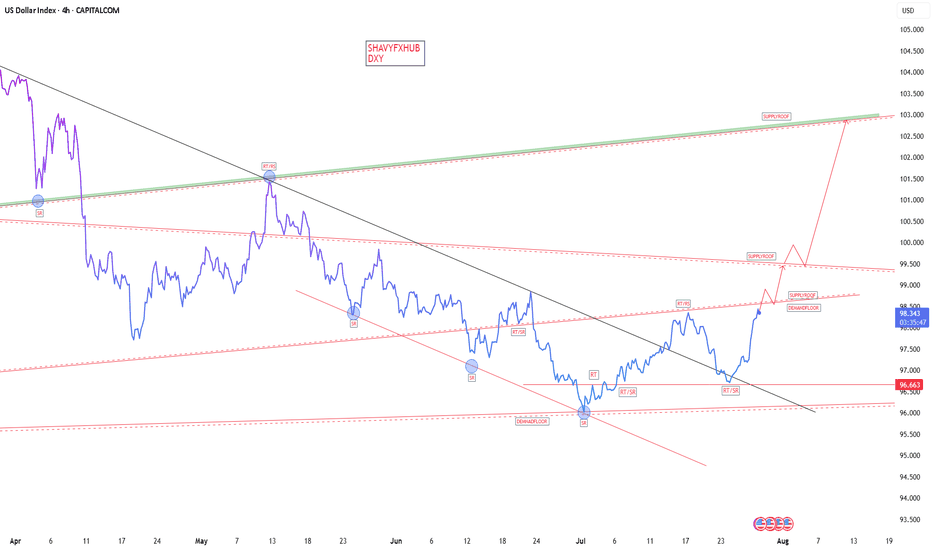
Dollar Index (DXY) — will reclaim 103-102 level if it crosses 100 mark currently is at 98.34 and faces immediate supply roof ,a make or break situation awaits dollar buyers .
Over the past month, the Dollar Index has gained about 2%, although it is still down over 5% compared to a year ago. The recent uptick follows a period of volatility and selling, with investors recalibrating expectations after the resolution of trade risk premiums and recent U.S.–EU trade deals.
US 10-Year Treasury Yield keep rising after its drop from 4.193% in early july to 4.5% on 17th
Yield on the US 10-year Treasury note is currently about 4.42% , modestly higher than last week and unchanged from the previous session.
Current levels reflect ongoing uncertainty regarding future Federal Reserve policy moves, cautious optimism regarding U.S. economic strength, and some abatement of safe-haven flows after recent global trade developments.
Relationship & Market Synopsis
DXY and the 10-year yield typically have a positive correlation: When Treasury yields rise, the dollar often follows, as higher yields make dollar-denominated assets more attractive to global investors. Conversely, falling yields can weigh on the dollar. However, in 2025, there have been periods of divergence due to external shocks and policy uncertainty.
Current setup: Both DXY and the 10Y yield are rising modestly, signaling a shift to a more constructive tone for the U.S. dollar as risk sentiment stabilizes and investors scale back some safe-haven trades. Recent U.S. economic resilience and fading tariff fears have reduced the need for defensive flows, supporting both yields and the dollar.
Forward outlook: Market consensus expects limited further upside for Treasury yields unless there are strong surprises in U.S. data or Federal Reserve communication. The DXY is projected to stabilize near current levels or drift higher on persistent U.S. economic momentum.
Summary:
Both the Dollar Index and US 10-year Treasury yield are modestly higher as of July 29, 2025. Their positive price action reflects improving US growth prospects, reduced global risk premiums, and recalibrated market expectations on Fed policy. While their relationship is generally positive, periods of divergence have occurred in 2025 due to trade, policy, and economic shocks. Currently, both are showing moderate gains as investor sentiment stabilize
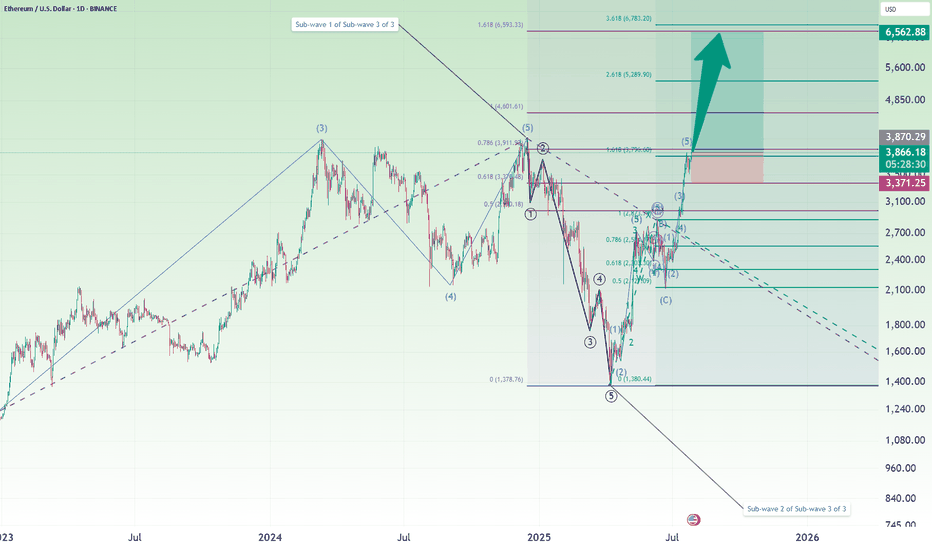
Ethereum Long: Using Log Chart to Analyze, Target $6600In this video, I go through the analysis using the log chart for Ethereum and shows the potential of this cryptocurrency where I expect the price to reach new high in the coming days with a longer-term target of $6600.
For shorter-term trading, I recommend placing the stop a distance below recent support on the daily chart, around $3372.
Good luck!
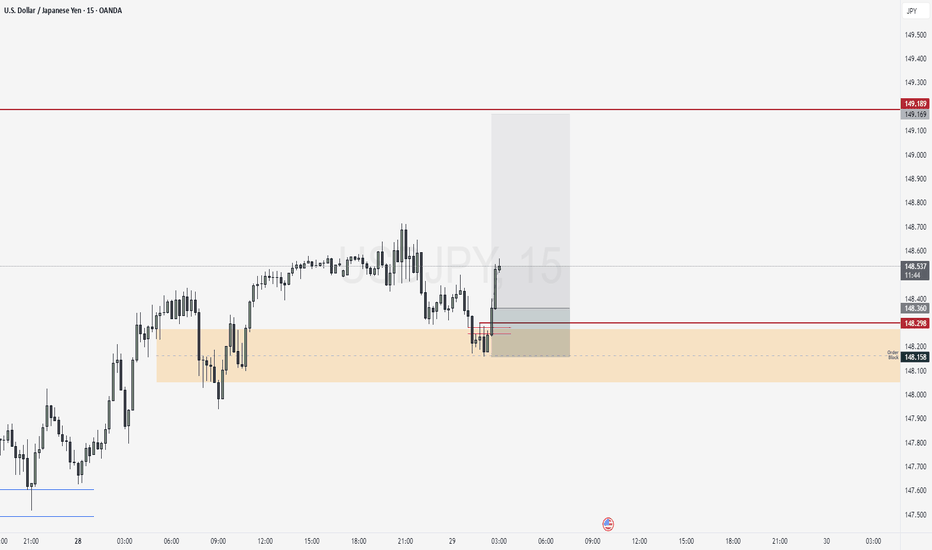
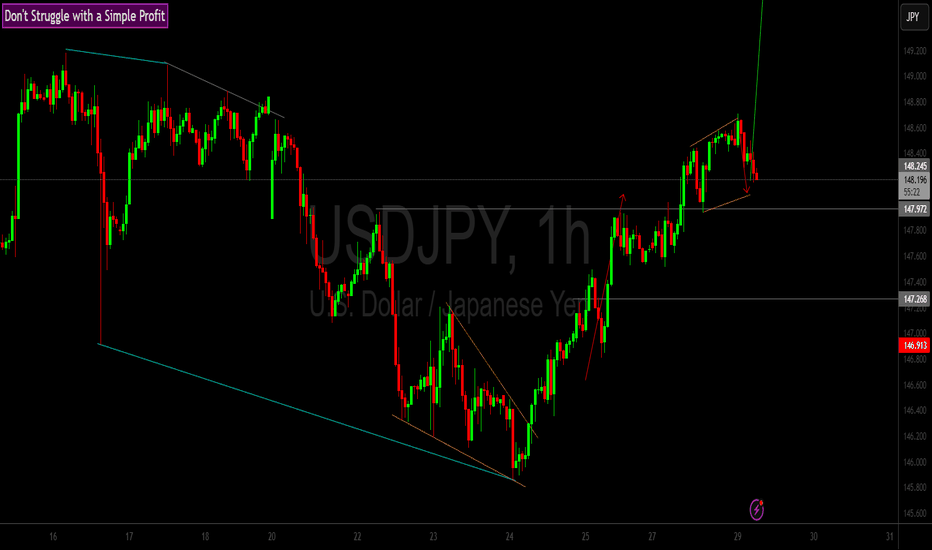
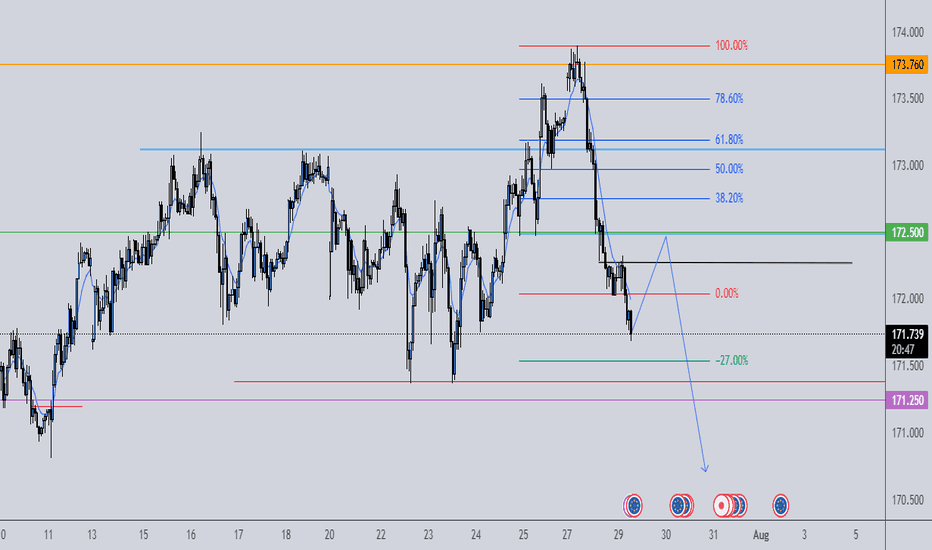
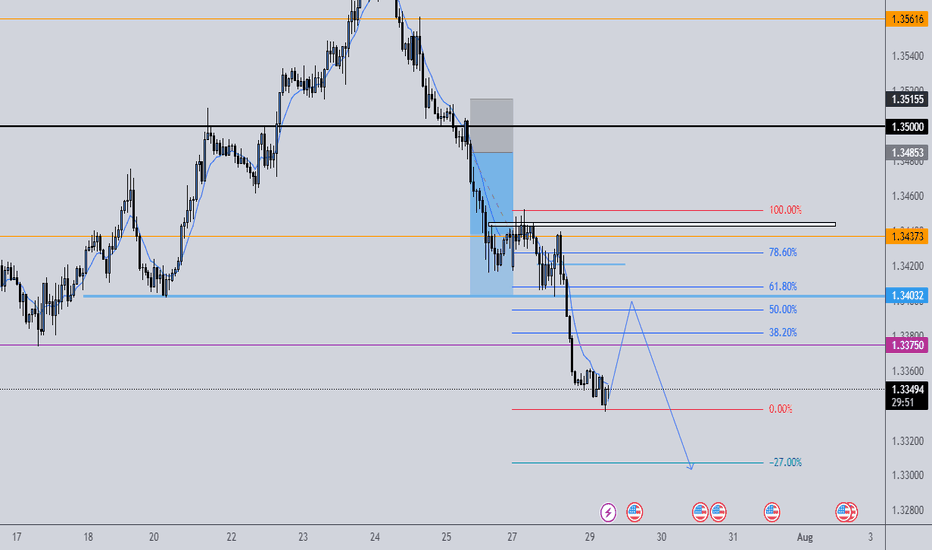
July 29, Forex Outlook : High-Reward Setups You Shouldn’t Miss!Welcome back, traders!
In today’s video, we’ll be conducting a Forex Weekly Outlook, analyzing multiple currency pairs from a top-down perspective—starting from the higher timeframes and working our way down to the lower timeframes.
Pairs to focus on this Week:
USDJPY
AUDJPY
CADJPY
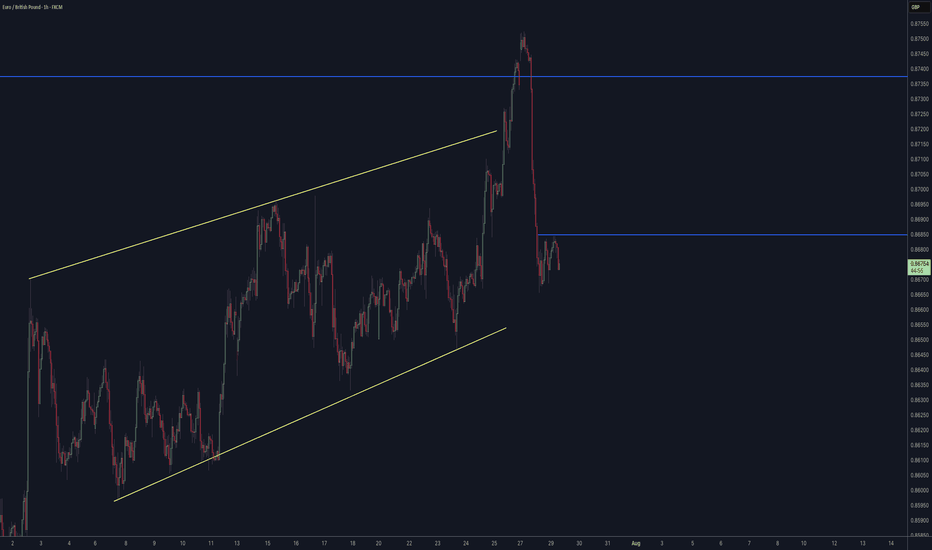
EURGBP
GBPCHF
USDCHF
NZDCHF
EURNZD
Our focus will be on identifying high-probability price action scenarios using clear market structure, institutional order flow, and key confirmation levels. This detailed breakdown is designed to give you a strategic edge and help you navigate this week’s trading opportunities with confidence.
📊 What to Expect in This Video:
1. Higher timeframe trend analysis
2. Key zones of interest and potential setups
3. High-precision confirmations on lower timeframes
4. Institutional insight into where price is likely to go next
Stay tuned, take notes, and be sure to like, comment, and subscribe so you don’t miss future trading insights!
Have a great week ahead, God bless you!
The Architect 🏛️📉
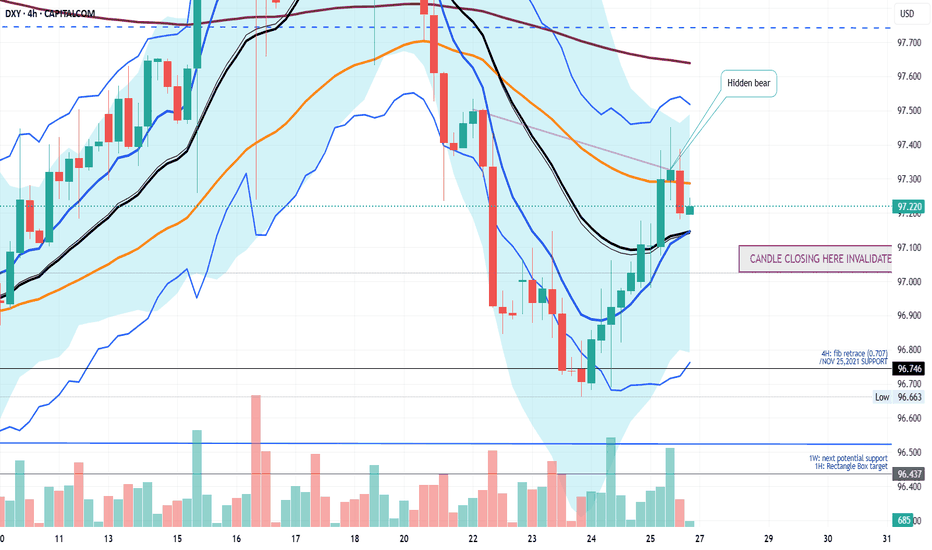
IS A HIGHER LOW SECURED ON THE DXY? LET'S FIND OUTIn this weekend analysis, I am still paying attention to the higher time frame downtrend on the dollar index while acknowledging the higher low support on the daily chart forming an inverse Head and Shoulders pattern. On the 4H and lower timeframes we have a strong ceiling made up of the 200SMA and 50SMA resistance level and need to break through from the 20SMA Line in the sand support. This weeks trade plan and thesis is for price to hold above the 20 SMA on the 4H timeframe expecting a potential dip to the zone of 97.128 (liquidity zone) and then bounce up to a weekly target of 97.7. This Thesis is INVALIDATED if a candle opens and closes below 97.015. I wish everyone a great trading week. Thank for supporting my publications and trade ideas. Cheers!!!
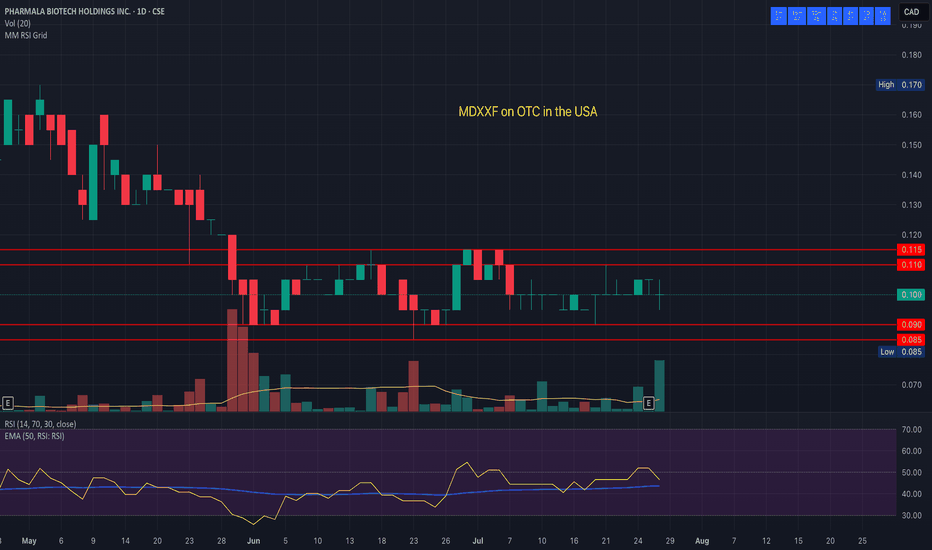
PharmAla Biotech Getting Very Tight, powerful break is imminentMDMA PharmAla Biotech Getting Very Tight, break is imminent. I have a bullish lean on this given the bullish tailwinds in the sector, the ramping up of bull volume on the weekly chart, and the lower wicks that look like accumulation to me on the monthly timeframe
I post regular analysis of the psychedelics sector, please like and follow to make sure you don't miss my next update!
Support: 0.090, 0.085
Resistance: 0.110, 0.115
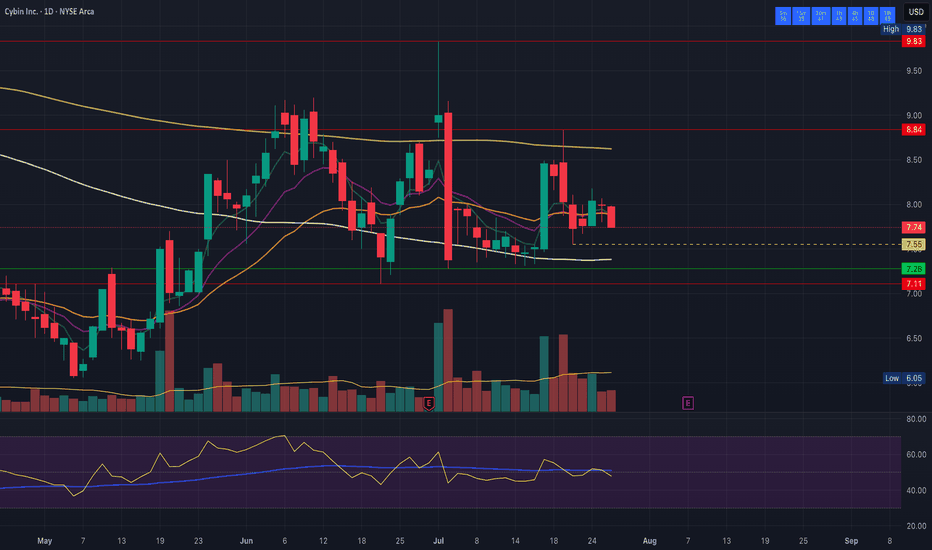
CYBN clearly the sector laggardCYBN is trading very differently from the rest of the sector which as significant bullish momentum which CYBN is the same price it was 7 weeks ago
I post regular analysis of the psychedelics sector, please like and follow to make sure you don't miss my next update!
Support: 7.74, 7.67, 7.55
Resistance: 7.99, 8.07, 8.18
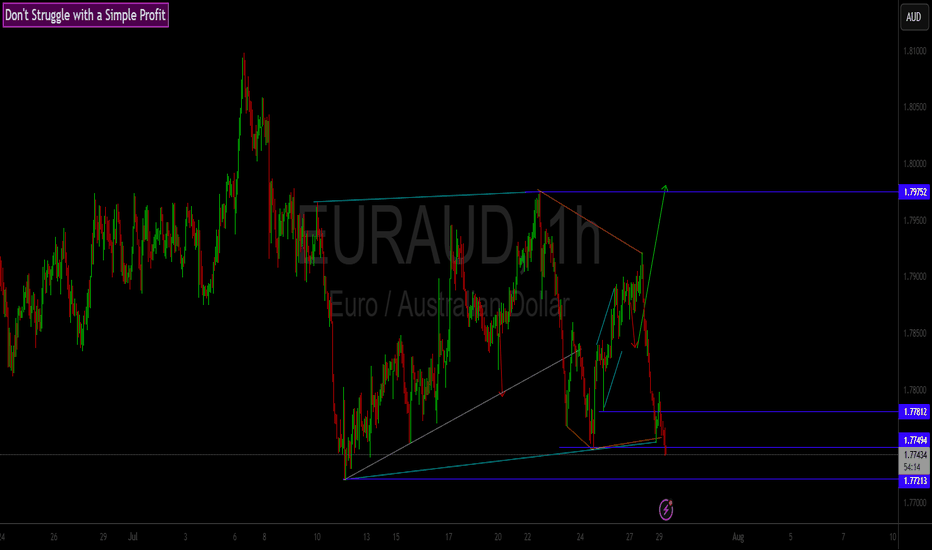
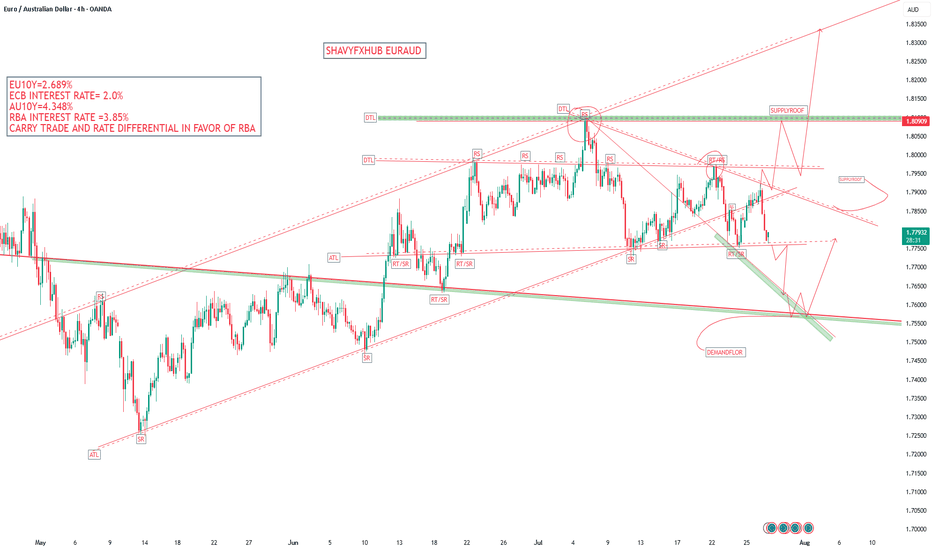
EURAUD THE CURRENT PRICEACTION OF EURAUD IS WATCHED.
EU10Y=2.689%
ECB RATE 2.0%
AU10Y= 4.348%
RBA RATE =3.85%
RATE AND BOND YIELD DIFFERENTIAL FAVOR AUD .
The recent fluctuations in the EUR/AUD exchange rate are primarily driven by factors including:
Monetary Policy and Interest Rate Differentials:
Decisions and outlooks from the European Central Bank (ECB) and the Reserve Bank of Australia (RBA) strongly impact EUR/AUD. Hawkish (tightening) or dovish (easing) policy stances influence demand for each currency, affecting the exchange rate. For example, higher interest rates or hawkish tones usually strengthen a currency, while easing weakens it. Differences in inflation rates and inflation expectations also play a part, as central banks adjust rates accordingly.
Economic Indicators and Growth Outlooks:
Economic performance disparities between the Eurozone and Australia—such as GDP growth, trade balances, and industrial versus commodity exports—drive currency strength or weakness. The Eurozone’s economy is more industrial and technological, while Australia's economy is strongly commodity-driven, especially by prices of iron ore and gold. Changes in global commodity prices or demand can cause the AUD to fluctuate vs the EUR.
Commodity Prices, Especially Gold:
Since Australia is a major gold producer, AUD tends to correlate positively with gold prices. Rising gold prices support AUD strength, which may lower EUR/AUD rates, and vice versa.
Global Risk Sentiment and Geopolitical Events:
Global market sentiment—whether investors seek risk or safe-haven assets—affects both currencies. The Euro and AUD react differently to geopolitical developments and trade tensions. For instance, increased risk appetite can strengthen AUD vs EUR and vice versa depending on circumstances.
In summary, the recent EUR/AUD fluctuations reflect the interplay of ECB and RBA policies, divergent economic data between Europe and Australia, commodity price movements (notably gold), and shifting global risk sentiment.
This explains why EUR/AUD rates move as they do: when the Eurozone outlook improves or ECB signals tightening while Australian commodity prices weaken or RBA signals easing, EUR tends to strengthen against AUD, and the pair rises. Conversely, stronger Australian growth, rising commodity prices, or hawkish RBA moves can push the pair lower.
#EURAUD
