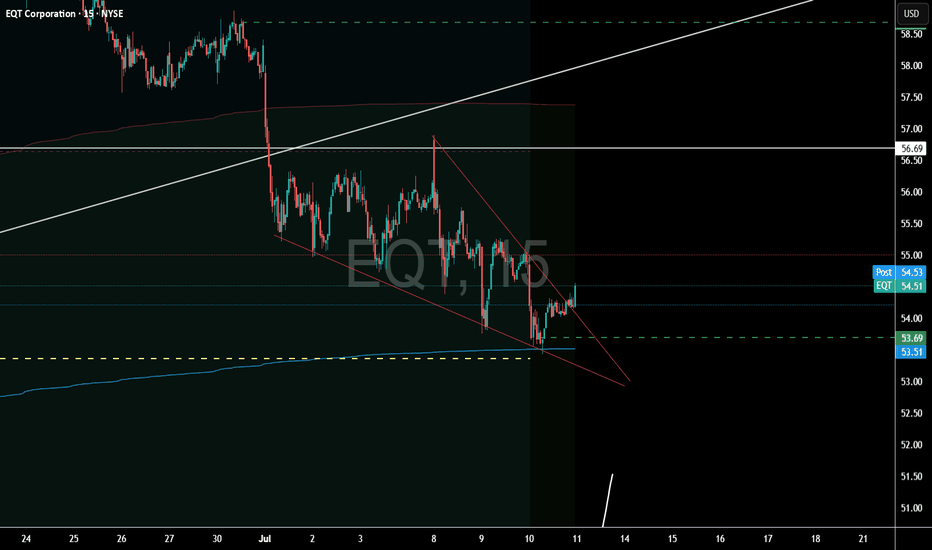
Natural Gas - The Epic Reversal? Natural gas had an astonishing move to the upside. Closing up over 5% today.
This volatility can make all tarders head spin if youre not used to it.
Why did Nat gas pop today?
Partly from being oversold and into really good technical support, Natural gas inventories were released today at 10:30am.
The inventories showed a smaller build than the market expected which implies stronger demand. 56B consensus vs 53B actual.
This could potentially be the start to a new bullish trend.
Names like EQT & AR hit some major support today. Some call options on these names have been accumulated.
Community ideas
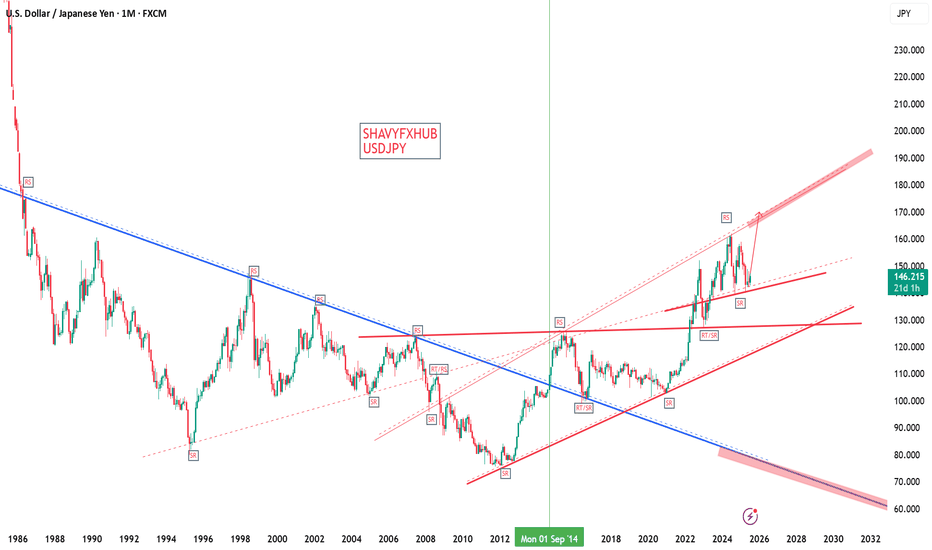
USDJPYUSDJPY ADVANCED OUTLOOK
US10Y=4.348% WEEKLY HIGH 4.436%
DXY=97.664$ weekly low 96.871
FED INTEREST RATE HELD STEADY LAST MEETING BY FOMC VOTE 4.25%-4.5%
Heads of the Federal Reserve (Fed) and Bank of Japan (BOJ)
Federal Reserve (Fed)
Chair: Jerome H. Powell
Term: Powell has served as Chair of the Board of Governors of the Federal Reserve System since February 5, 2018. He was reappointed for a second four-year term on May 23, 2022, which is set to run until May 2026.
Background: Powell is an American investment banker and lawyer, known for his consensus-building approach and steady leadership during periods of economic uncertainty. He has been a member of the Board of Governors since 2012.
Bank of Japan (BOJ)
Governor: Kazuo Ueda
Term: Kazuo Ueda has served as Governor of the Bank of Japan since April 2023. He is a distinguished academic with a PhD in economics from MIT and has guided the BOJ through its recent policy normalization and interest rate increases.
Key Executive: Koji Nakamura was appointed as the BOJ’s Executive Director overseeing monetary policy and financial markets in April 2025, supporting Governor Ueda in policy implementation.
BOJ ( BANK OF JAPAN) 10 year bond yield
JP10Y=1.491% HIGH FOR THE WEEK 1.515%
BOJ INTEREST RATE =0.5%
Interest Rate Differential:
US Federal Reserve rate: 4.25%–4.50%.- BOJ 0.5%=3.75%-4%
the interest rate differential favor USD LONG
Bank of Japan (BoJ) rate: 0.5% comes in higher giving yen a shot advantage ,on monthly TF USDJPY remains bearish.
10-Year Bond Yield Differential:
Us10y 4.35% -JP10Y 1.515%= 2.835%
The bond yield spread continues to favor the dollar, attracting capital to US assets.
Monetary Policy Outlook:
The BoJ remains cautious, signaling a slow pace of further tightening.
The Fed is expected to maintain higher rates in the near term, though some easing is anticipated later in 2025.
Technical and Fundamental Summary
Trend: USD/JPY remains in a bullish trend, we will have upside potential if US yields stay elevated and BoJ remains dovish.
the monthly TF remains bearish and its something to watch.
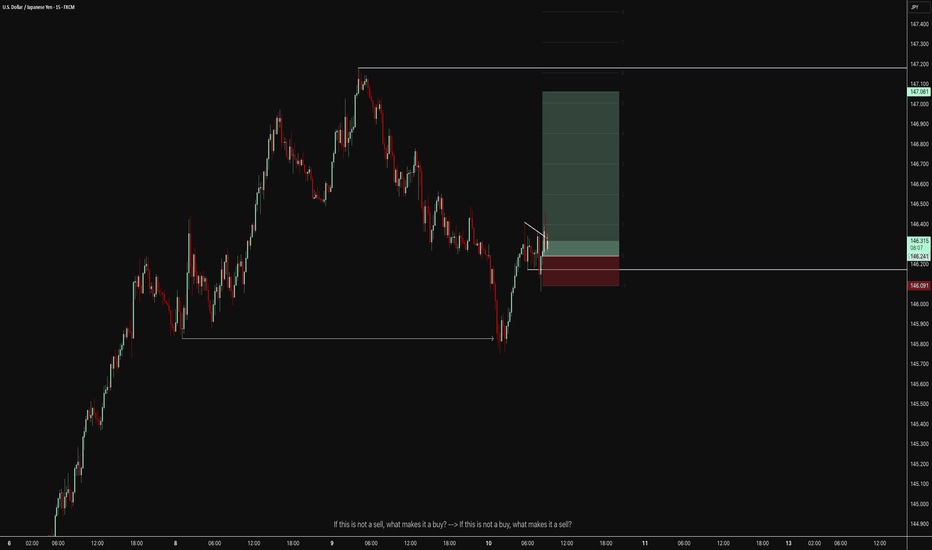
The USD/JPY pair is expected to remain supported above 145 as long as the interest rate and bond yield differentials favor the US.
Upside risks exist if US economic data outperforms or if the BoJ maintains its cautious stance.
Downside risks could emerge if the Fed signals faster rate cuts or if there is a significant shift in risk sentiment favoring the yen.
In summary:
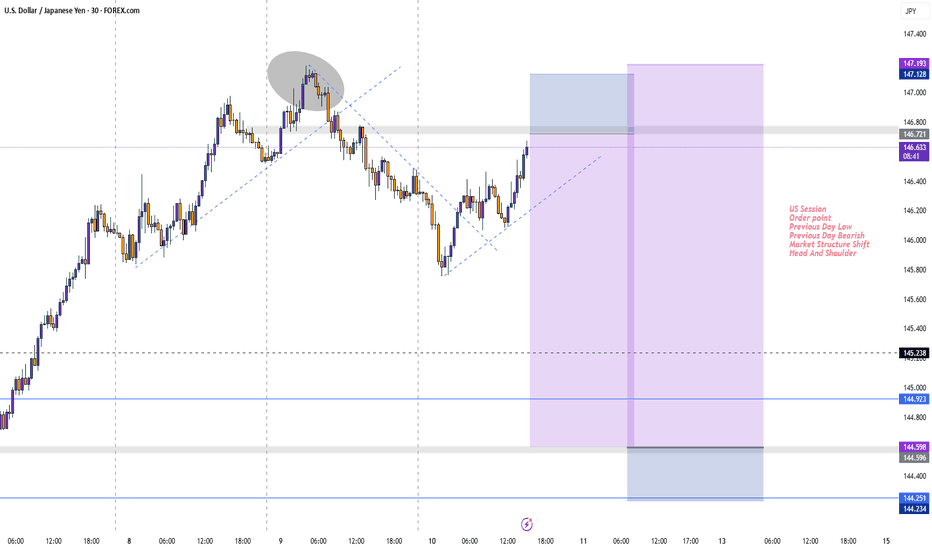
USD/JPY is trading near 146.231, with the US dollar supported by higher interest rates and bond yields relative to Japan. The pair’s direction will remain sensitive to central bank policy signals and global risk sentiment in the coming weeks.
1. Uncovered Interest Rate Parity (UIP) –
Uncovered Interest Rate Parity (UIP) is a fundamental theory in international finance and foreign exchange markets. It states that the difference in interest rates between two countries should equal the expected change in their exchange rates over the same period. The concept assumes no arbitrage opportunities and that investors are risk-neutral.
Implication:
If one country has a higher interest rate, its currency is expected to depreciate by the same amount as the interest rate differential.
Carry Trade:
If UIP holds, there is no excess return from borrowing in a low-interest currency and investing in a high-interest one, as exchange rate movements offset the interest rate advantage.
Covered vs. Uncovered:
Covered Interest Rate Parity (CIP): Uses forward contracts to hedge exchange rate risk.
Uncovered Interest Rate Parity (UIP): No hedging; relies on expected spot rates.
Example:
If US rates are 4.5% and JPY rates are 0.5%, UIP predicts the US dollar will depreciate by 4% against the JAPANESE YEN over the period, making returns equal after accounting for currency changes.
Given the USD interest rate of 4.5% and the Bank of Japan (BOJ) interest rate of 0.5%, the Uncovered Interest Rate Parity (UIP) and Covered Interest Rate Parity (CIP) conditions is as follows:
1. Uncovered Interest Rate Parity (UIP)
UIP states that the expected change in the spot exchange rate between two currencies equals the interest rate differential between those countries. In other words, the currency with the higher interest rate is expected to depreciate relative to the currency with the lower interest rate by roughly the interest rate differential.
Interpretation:
Since the USD interest rate (4.5%) is higher than the BOJ rate (0.5%), UIP predicts that the USD will depreciate against the JPY by approximately the interest rate differential of 4.0% annually.
This means that although USD offers higher yields, investors expect the USD to weaken relative to JPY over the investment horizon, offsetting the higher interest return.
2. Covered Interest Rate Parity (CIP)
CIP states that the forward exchange rate should adjust to offset the interest rate differential, eliminating arbitrage opportunities by using forward contracts to hedge exchange rate risk.
With USD rates higher than JPY rates, the USD is expected to trade at a forward discount relative to JPY, meaning the forward USD/JPY rate will be lower than the spot rate to compensate for the higher USD interest rate.
This ensures no arbitrage profit from borrowing in JPY and investing in USD while hedging currency risk.
This implies the forward rate is about 151.82 USD/JPY, higher than the spot rate, indicating a forward premium on USD relative to JPY.
Note: This suggests USD is trading at a forward premium, which contradicts the earlier interpretation. This discrepancy arises because in USD/JPY quoting, USD is the base currency and JPY the quote currency. The direction of the interest rate differential effect depends on the quoting convention.
Important Clarification on Quoting Conventions:
USD/JPY is quoted as Japanese yen per 1 US dollar.
When the domestic currency is USD, and foreign currency is JPY, the formula applies as above.
Since USD interest rates are higher, the JPY is trading at a forward discount relative to USD, meaning the forward USD/JPY rate is higher than the spot rate (USD is expected to appreciate).
Summary:
Aspect Result / Interpretation
Interest Rate Differential USD 4.5% vs. JPY 0.5% → 4.0% differential
UIP Prediction USD expected to appreciate against JPY by ~4% (due to quoting)
CIP Forward Rate Forward USD/JPY rate > Spot rate (USD at forward premium)
Carry Trade Borrow in low-rate JPY, invest in high-rate USD to earn carry
Conclusion:
With USD interest rate at 4.5% and BOJ rate at 0.5%, the covered interest rate parity (CIP) implies the USD will trade at a forward premium against JPY, i.e., the forward USD/JPY rate will be higher than the spot rate by roughly the interest rate differential.
The uncovered interest rate parity (UIP) suggests that investors expect the USD to appreciate against JPY by about 4% over the investment horizon, compensating for the higher USD interest rate.
This supports typical carry trade strategies where investors borrow in low-yielding JPY and invest in high-yielding USD assets, profiting from the interest differential.
#usdjpy #dollar #yen #jpy
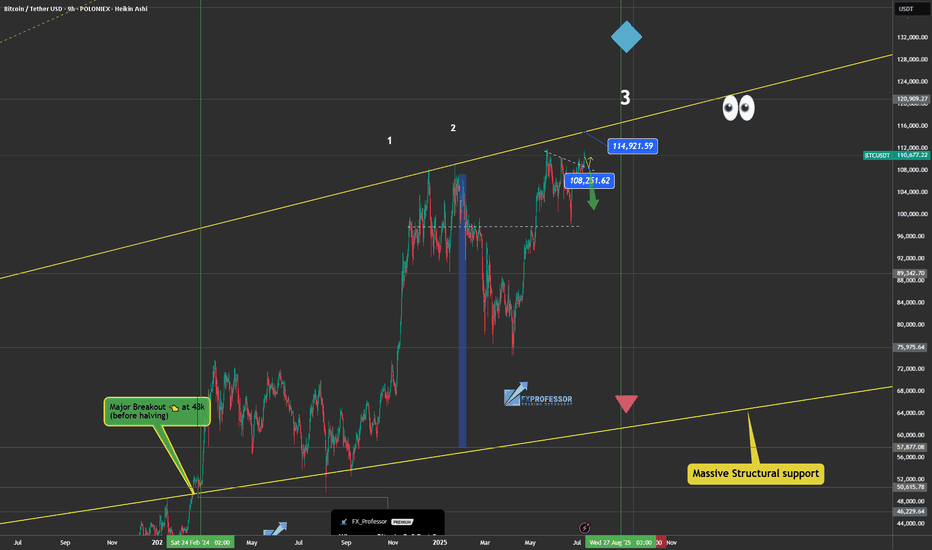
July 10th Market Outlook –Charted Waters & Uncertain Momentum🗓️📊 July 10th Market Outlook – Charted Waters & Uncertain Momentum 🌊⚠️
Today’s breakdown is a reality check for traders navigating a market full of setups but short on clarity. Resistance is stacking across the board, but that doesn’t mean we can’t break through — it just means we need to stay sharp and keep our charts close.
🔎 Highlights from the 19-minute video:
Bitcoin is approaching a third and crucial resistance test. A breakout could trigger ultra-FOMO, but failure here could send us lower.
Ethereum is in a pressure zone — the "Symplegades" setup from Greek mythology reflects today’s narrow trading path.
Bitcoin Dominance is clinging to support — if it breaks, altseason could be on. If it holds, alts may stay sidelined.
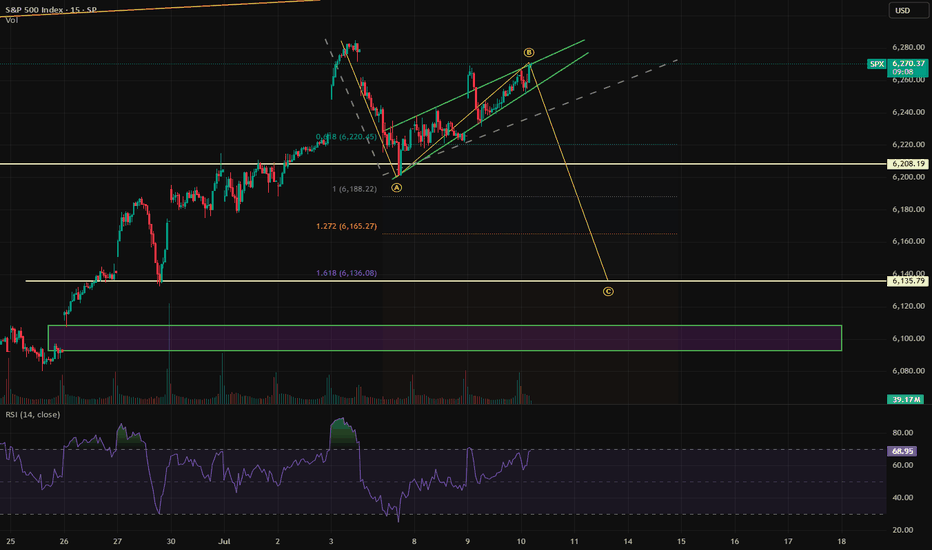
NASDAQ & Nvidia have delivered massive runs, but signs of exhaustion and reversal risk are showing.
Dollar Index (DXY) showing a Golden Cross, but unresolved rate expectations could catch markets off guard.
💬 I also speak candidly about market manipulation, being someone else’s exit liquidity, and why we might be heading toward a formative trap before any true breakout.
🎥 Watch the full video to catch all the details — from long-term setups to real-time chart reactions.
📌 Stay tuned for detailed updates today on Bitcoin, Ethereum, Bitcoin Dominance, NASDAQ and more.
One Love,
The FXPROFESSOR 💙
Disclosure: I am happy to be part of the Trade Nation's Influencer program and receive a monthly fee for using their TradingView charts in my analysis. Awesome broker, where the trader really comes first! 🌟🤝📈
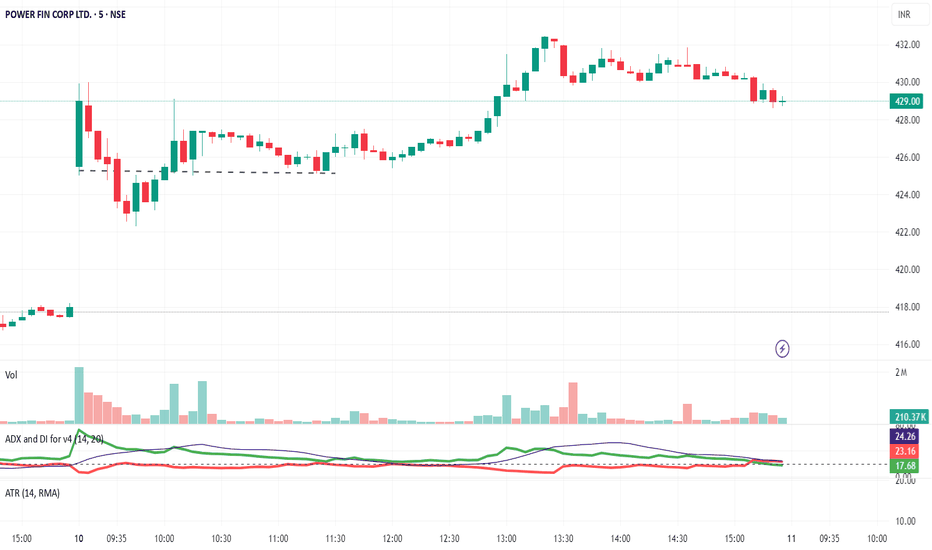
Review and plan for 11th July 2025 Nifty future and banknifty future analysis and intraday plan.
Analysis of "what i traded today".
This video is for information/education purpose only. you are 100% responsible for any actions you take by reading/viewing this post.
please consult your financial advisor before taking any action.
----Vinaykumar hiremath, CMT
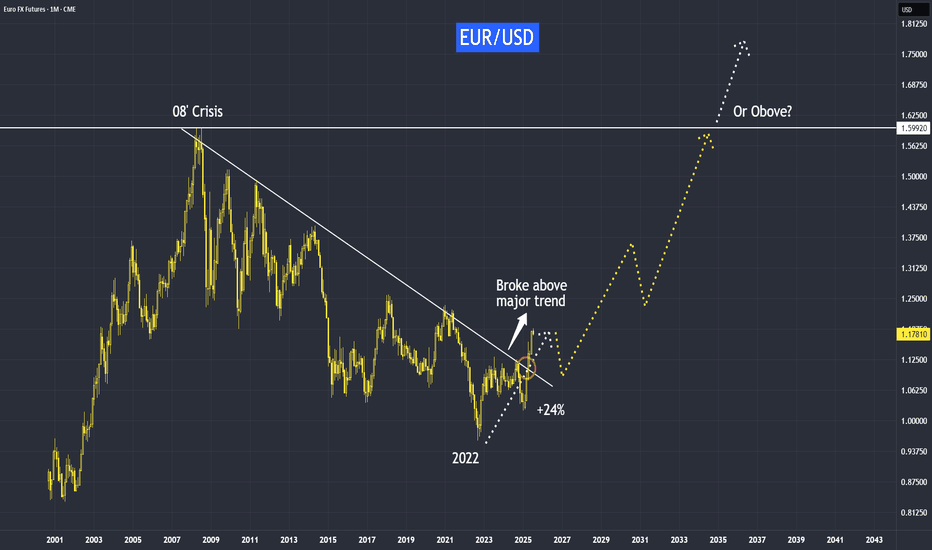
Opportunities Arise from Dollar WeaknessSince the dollar peaked in 2022, it has declined by 24%.
Such a decline may not seem significant for a stock, it’s a different story when it comes to currencies, especially a reserve currency for USD. US purchasing power has dropped by a quarter, meaning they will now have to pay 24% more for imports from EU.
However, the decline in the USD also presents opportunities in other markets.
Mirco EUR/USD Futures
Ticker: M6E
Minimum fluctuation:
0.0001 per euro = $1.25
Disclaimer:
• What presented here is not a recommendation, please consult your licensed broker.
• Our mission is to create lateral thinking skills for every investor and trader, knowing when to take a calculated risk with market uncertainty and a bolder risk when opportunity arises.
CME Real-time Market Data help identify trading set-ups in real-time and express my market views. If you have futures in your trading portfolio, you can check out on CME Group data plans available that suit your trading needs tradingview.sweetlogin.com
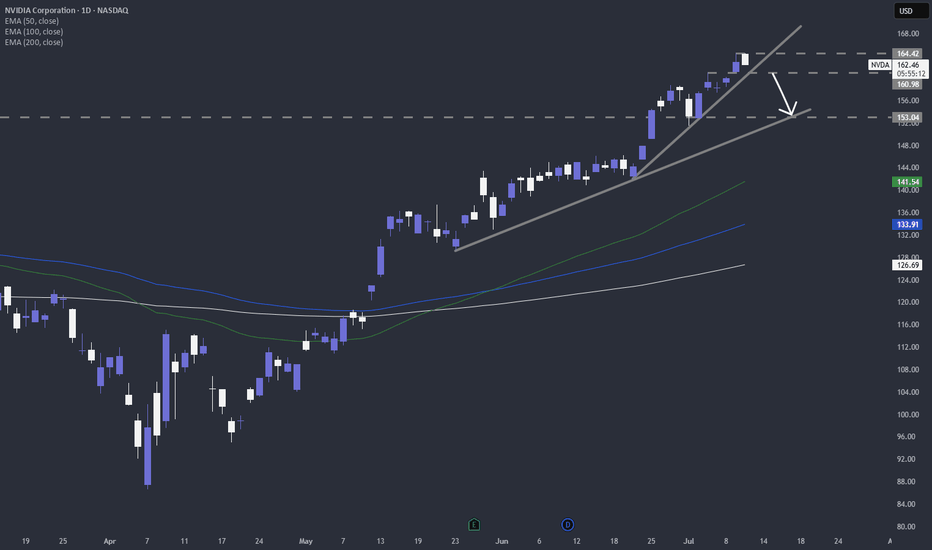
A bit of profit taking on NVDA and then up again?NASDAQ:NVDA is the most talked about and everyone is capitalizing on that. Let's take a look.
NASDAQ:NVDA
Let us know what you think in the comments below.
Thank you.
75.2% of retail investor accounts lose money when trading CFDs with this provider. You should consider whether you understand how CFDs work and whether you can afford to take the high risk of losing your money. Past performance is not necessarily indicative of future results. The value of investments may fall as well as rise and the investor may not get back the amount initially invested. This content is not intended for nor applicable to residents of the UK. Cryptocurrency CFDs and spread bets are restricted in the UK for all retail clients.
AUDCHF; Heikin Ashi Trade IdeaOANDA:AUDCHF
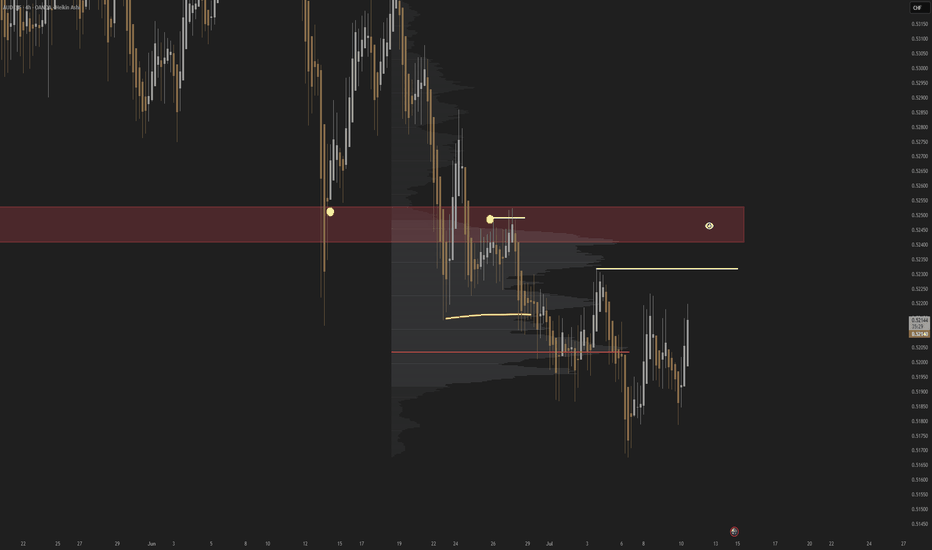
In this video, I’ll be sharing my analysis of AUDCHF, using FXAN's proprietary algo indicators with my unique Heikin Ashi strategy. I’ll walk you through the reasoning behind my trade setup and highlight key areas where I’m anticipating potential opportunities.
I’m always happy to receive any feedback.
Like, share and comment! ❤️
Thank you for watching my videos! 🙏
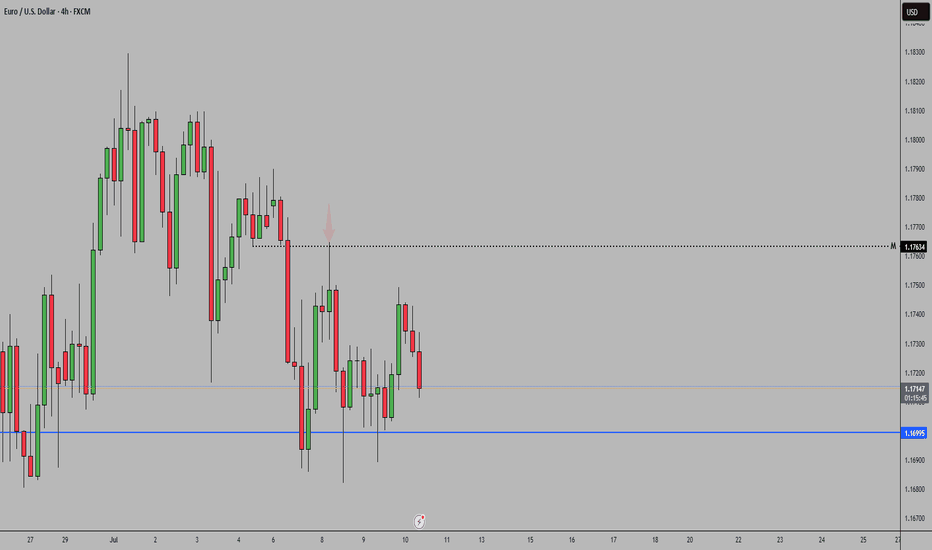
EURUSDSentiment: Bullish Bias
Institutions are holding a strong net long position on the Euro, with +107,537 contracts. This reflects continued bullish sentiment toward EUR, suggesting strength against the USD. With DXY showing net shorts and EUR net longs, EUR/USD may favor upside moves, especially from key daily demand zones. Swing traders should watch for bullish confirmations and structure shifts on 4H.
DXYInstitutions are currently holding a net short position on the Dollar, indicating bearish sentiment. With a net position of -4,282, we may expect continued weakness in the DXY, especially if price reacts from key supply zones. Swing traders should remain cautious with long setups and prioritize opportunities aligned with USD weakness across major pairs.
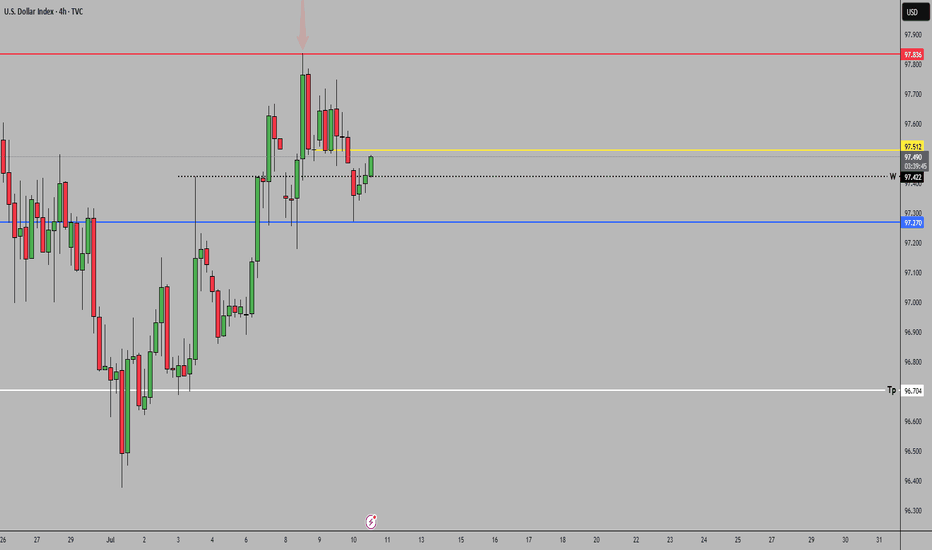
Forex Weekly Round-Up: DXY, GBPUSD, EURUSDKey Price Zones (DXY): 97.422 - 97.685
🟦 DXY (Dollar Index):
On paper, USD had a strong week:
🔹 Durable Goods smashed expectations (+8.6% vs 0.5%)
🔹 PMIs, GDP Price Index, and Jobless Claims came in solid
But the market ignored it:
🔻 Consumer Confidence disappointed (93.0 vs 99.4)
🏠 New Home Sales missed
🕊️ Fed Chair Powell stayed soft — no aggressive tightening talk
Result?
Despite strong fundamentals, DXY broke down, sweeping daily lows and printing fresh bearish structure.
It’s now down ~10% YTD — the worst first half in over 50 years.
📈 EURUSD & GBPUSD: Holding Strong Despite Weak Data
EURUSD
German Retail Sales: –1.6%
Import Prices: –0.7%
ECB tone: muted
Still, EURUSD held daily support and gained — thanks to broad USD weakness.
GBPUSD
Current Account widened (–£23.5B), GDP unchanged
No standout UK catalyst
Yet GBPUSD held its ground and edged higher as DXY continued to fall.
🧠 What This Tells Us
Strong data isn’t always enough.
When price action, market sentiment, and liquidity targets align — they override the numbers.
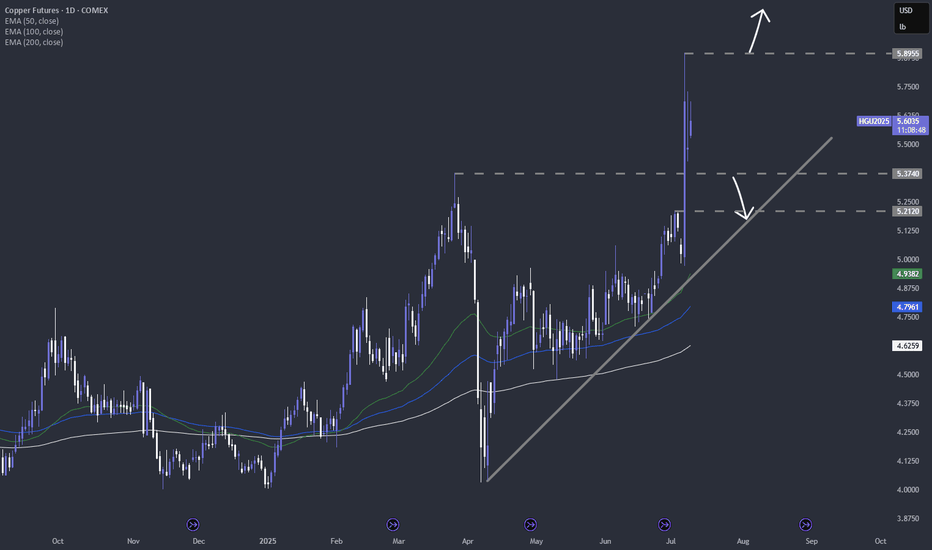
Copper - the hot topic this weekUS is planning to implement tariffs on copper imports at a scale of 50%. It's an interesting move, which might not make much sense. Let's dig in.
MARKETSCOM:COPPER
COMEX:HG1!
Let us know what you think in the comments below.
Thank you.
75.2% of retail investor accounts lose money when trading CFDs with this provider. You should consider whether you understand how CFDs work and whether you can afford to take the high risk of losing your money. Past performance is not necessarily indicative of future results. The value of investments may fall as well as rise and the investor may not get back the amount initially invested. This content is not intended for nor applicable to residents of the UK. Cryptocurrency CFDs and spread bets are restricted in the UK for all retail clients.
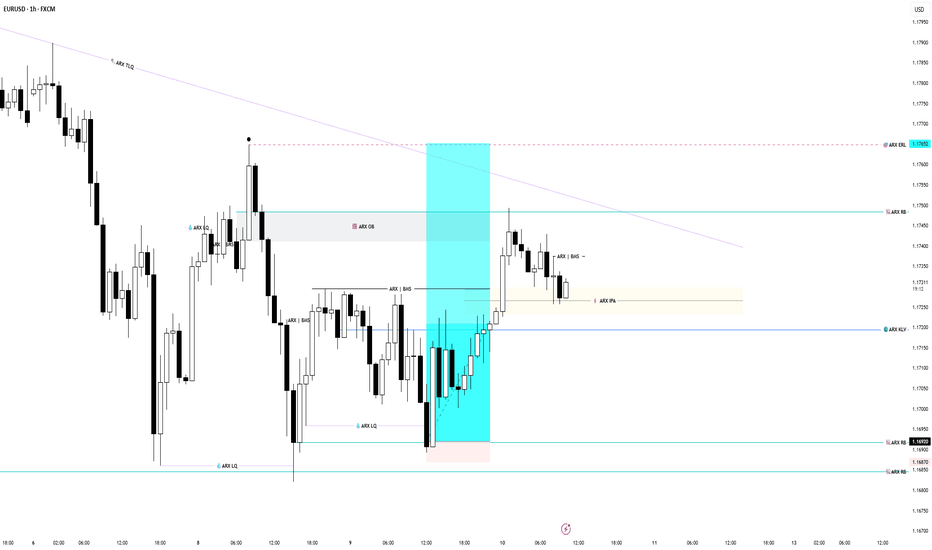
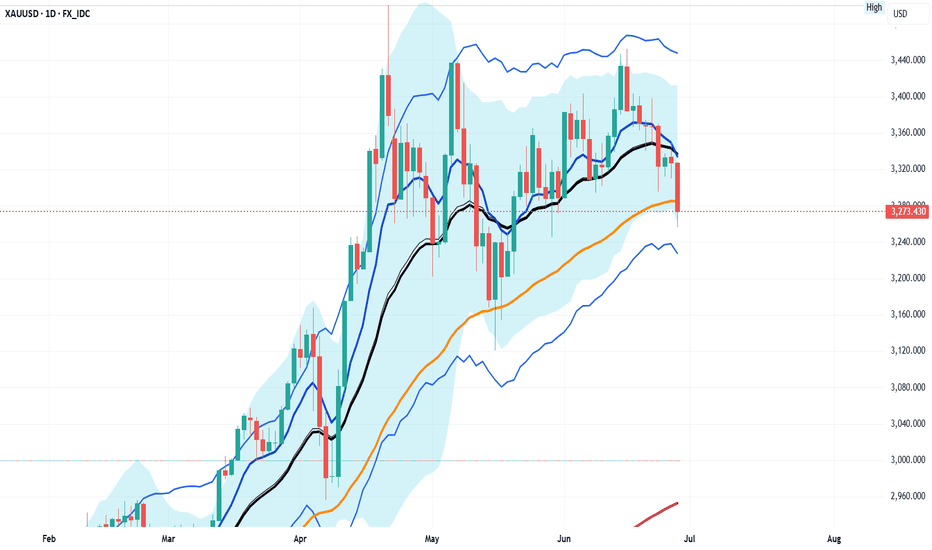
EURUSD & Gold Clean Trades & What’s Next | ARX InsightsIn this video, I walk through the key price action setups we observed today on EURUSD and Gold (XAUUSD), including why we took the trades and what structure we’re watching next.
This is an educational breakdown based on the ARX | Price & Time approach focused on confluence, execution logic, and trader mindset.
📌 Not financial advice. For educational purposes only.
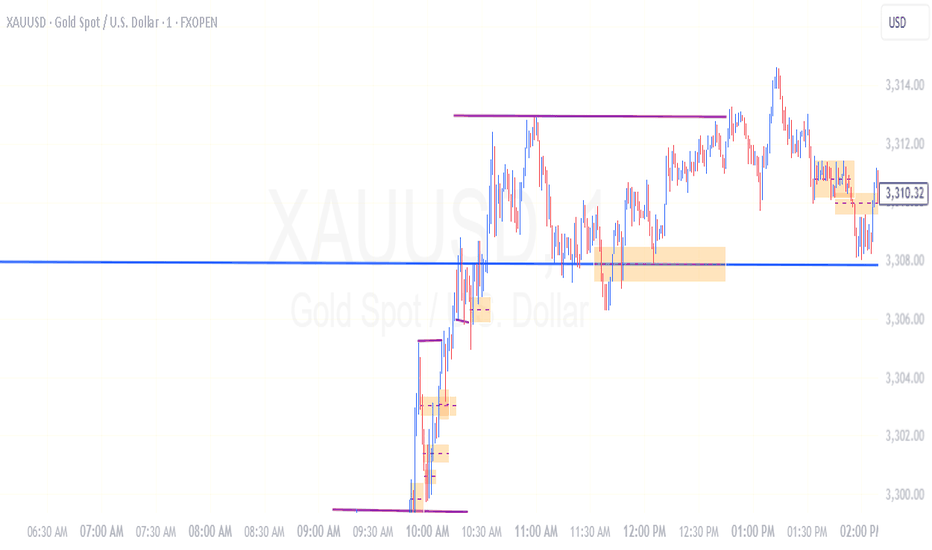
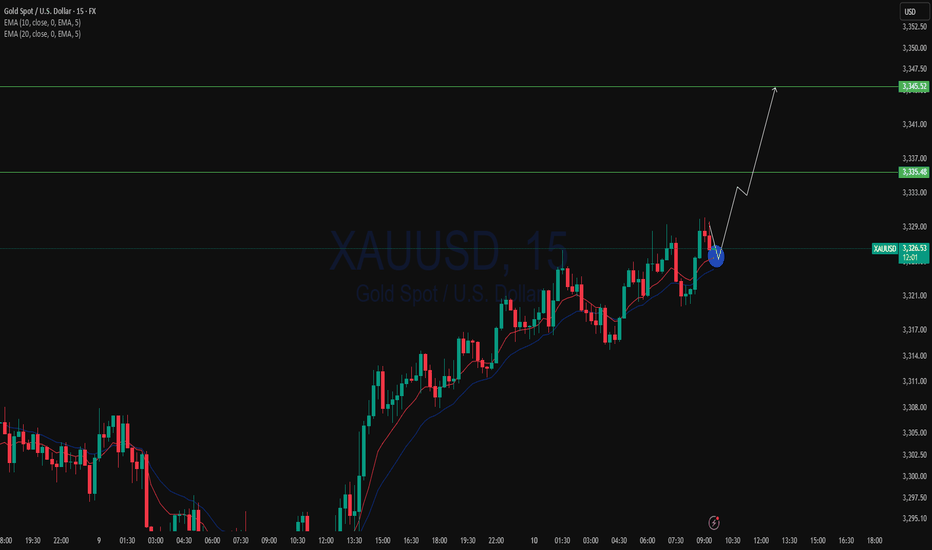
XAUUSD Analysis todayHello traders, this is a complete multiple timeframe analysis of this pair. We see could find significant trading opportunities as per analysis upon price action confirmation we may take this trade. Smash the like button if you find value in this analysis and drop a comment if you have any questions or let me know which pair to cover in my next analysis.
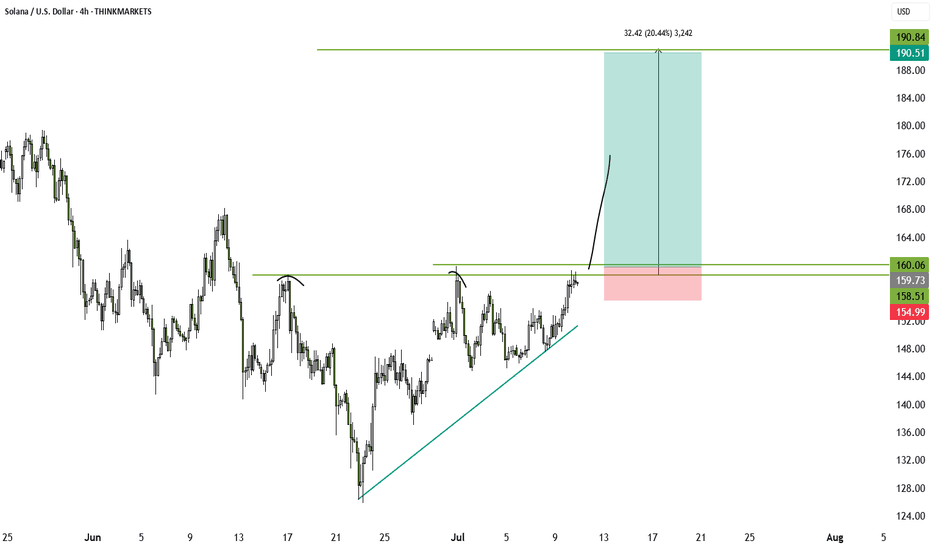
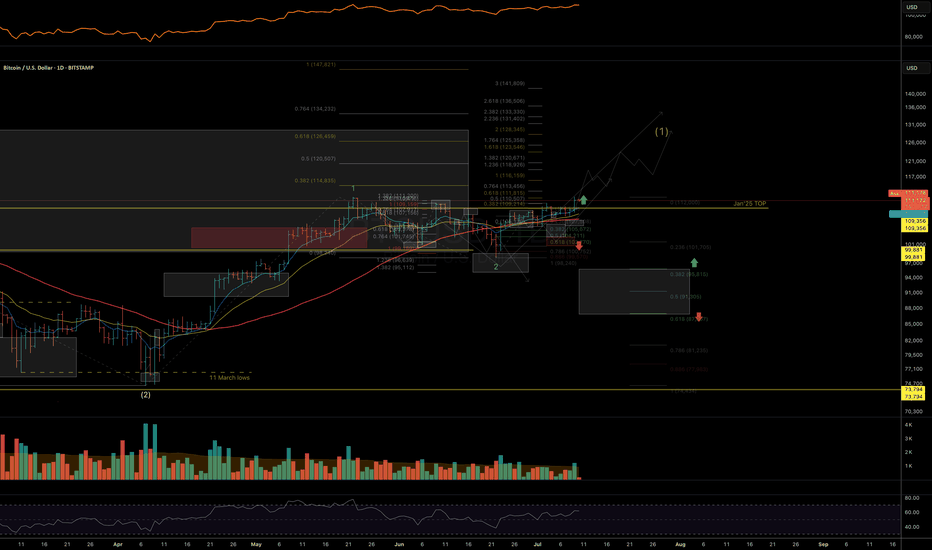
BTC / ETH / SOL / XRP / HYPE: Potential Trend StructuresIn this video, I share my current daily and weekly analysis on the trend structures of BTC, ETH, SOL, XRP, and HYPE, highlighting key support and resistance zones to watch in the coming sessions.
Charts featured in the video:
BTC
ETH
SOL
XRP
HYPE
Thank you for your attention and I wish you successful trading decisions!
If you’d like to hear my take on any other coin you’re tracking feel free to ask in the comments (just don’t forget to boost the idea first 😉).
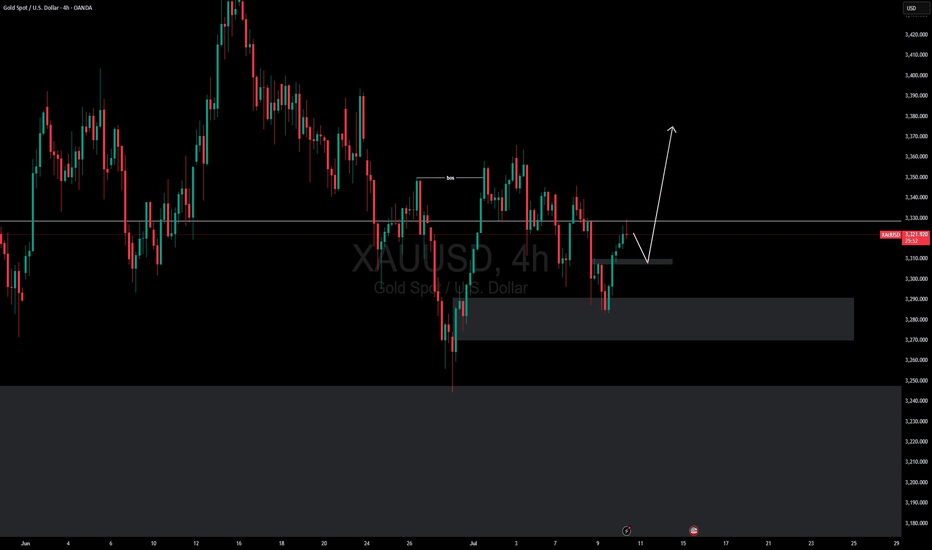
Am I looking for longs on XAUUSD?Hello traders , here is the full multi time frame analysis for this pair, let me know in the comment section below if you have any questions , the entry will be taken only if all rules of the strategies will be satisfied. wait for more price action to develop before taking any position. I suggest you keep this pair on your watchlist and see if the rules of your strategy are satisfied.
🧠💡 Share your unique analysis, thoughts, and ideas in the comments section below. I'm excited to hear your perspective on this pair .
💭🔍 Don't hesitate to comment if you have any questions or queries regarding this analysis.
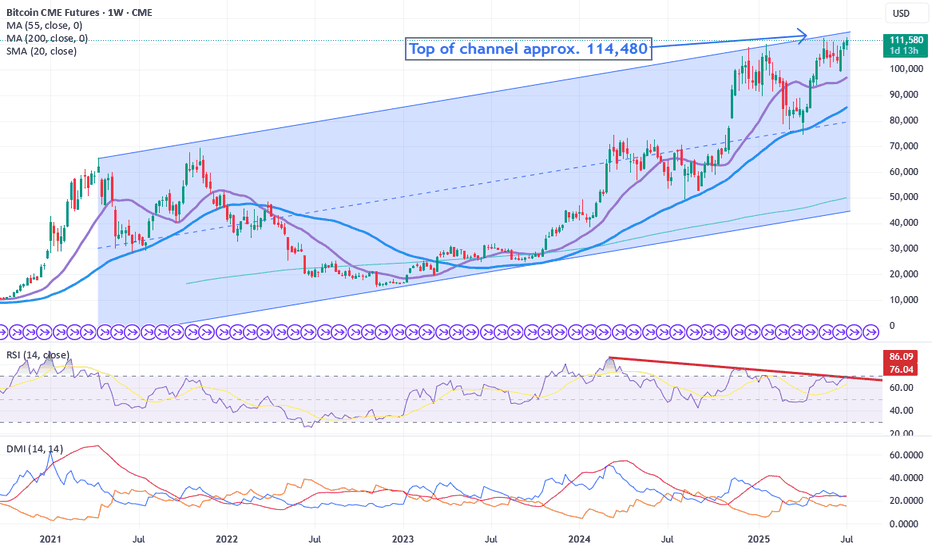
Bitcoin UpdateBitcoin has just broken out above its recent consolidation pattern, staying firmly in an uptrend and finding solid short-term support at its 55-day moving average.
We're now pushing toward the previous high at 112,345, chipping away at that level. Once cleared, our eyes turn to the weekly chart, which reveals a 4-year ascending channel — with the top sitting around 114,480, our broader target.
Disclaimer:
The information posted on Trading View is for informative purposes and is not intended to constitute advice in any form, including but not limited to investment, accounting, tax, legal or regulatory advice. The information therefore has no regard to the specific investment objectives, financial situation or particular needs of any specific recipient. Opinions expressed are our current opinions as of the date appearing on Trading View only. All illustrations, forecasts or hypothetical data are for illustrative purposes only. The Society of Technical Analysts Ltd does not make representation that the information provided is appropriate for use in all jurisdictions or by all Investors or other potential Investors. Parties are therefore responsible for compliance with applicable local laws and regulations. The Society of Technical Analysts will not be held liable for any loss or damage resulting directly or indirectly from the use of any information on this site.
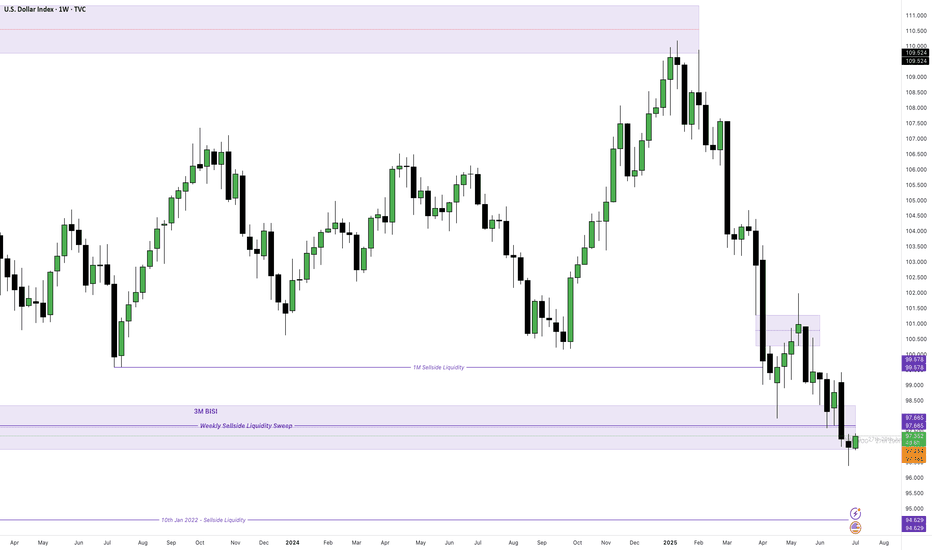
Weekly Analysis of the Dollar Index, BTC, SPX500, NAS100 & GOLDIn this week's video I break down key technical patterns and indicators to discuss the behavior and direction of the Dollar index, Bitcoin, SPX500 and NAS100 Indices and finally GOLD for the coming week. I highlight price trends, support and resistance levels, candlestick formations, and moving averages to identify potential targets. My goal is to interpret market sentiment and forecast possible price movements based on historical data and technical signals. I hope you find value in my analysis to make informed trade and investment decisions. Cheers
